Insights
Where correlation fails

Conventional statistics hide important realities that investors need to know.
August 2023
The correlation coefficient often fails to capture what really matters to investors.
Our research shows that correlations can vary through time based on a range of conditions including the level of interest rates, the degree of turbulence in financial markets and the performance of major equity markets. Overall, our findings challenge the notion that returns evolve as a simple “random walk,” a critical pre-condition without which we must interpret the correlation coefficient distrustfully. To address these issues, we introduce the notion of co-occurrence and offer a new perspective on how investors should diversify portfolios in our latest report.
Key highlights
For more than seven decades, investors have turned to the correlation coefficient as a way to ensure they are putting their proverbial eggs into multiple baskets. Statistically, it is a normalized measure of the average co-movement between assets that ranges between -1 and 1. A negative correlation means that one asset is likely to zig when the other zags, whereas a positive one means the two assets tend to move in tandem. But does this measure, also known as the Pearson correlation, capture what investors actually care about?
In this paper, we argue that the answer is often no. There are two reasons for this. Both reasons challenge the notion that returns are “IID,” a critical pre-condition without which we must interpret the correlation coefficient distrustfully.

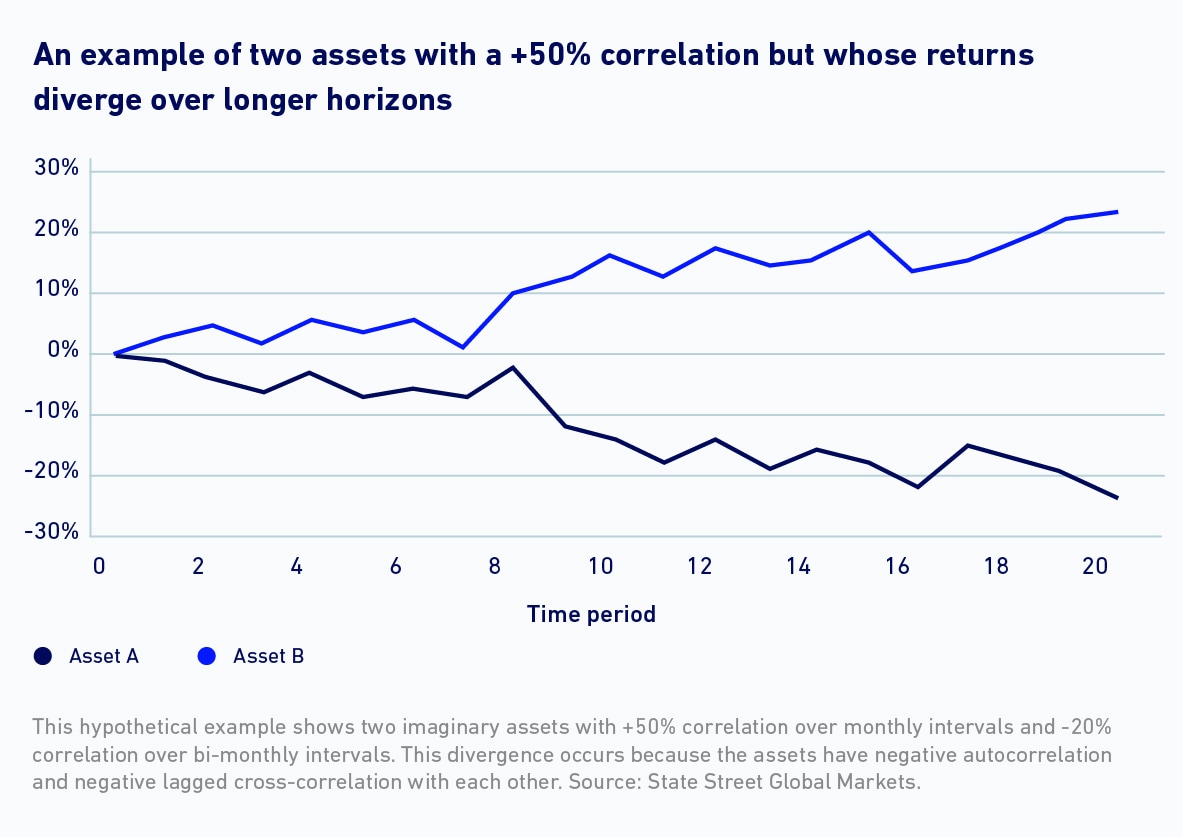
The first reason has to do with the notion of divergence, an example of which is shown in the chart. Investors often measure correlations using monthly data and assume that they also hold over one-year, five-year or 10-year periods. They have good reason for this: It is exactly what happens if returns come from a well-behaved IID distribution. Unfortunately, in the real world, this assumption often fails, which indicates short- and long-interval correlations can diverge. A high (low) correlation over short intervals does not guarantee that assets will move in tandem (opposition) over longer ones.
The second reason has to do with a fundamental misconception about diversification. The fact is, investors do not always want it. Sure, they want it on the downside, in order to offset the poor performance of one or more assets. However, on the upside, they prefer all assets to rise in unison, which is the opposite of diversification. Put differently, they would be perfectly happy to place their eggs, quite conveniently, in a single basket – provided nobody steals it.
Our research shows that correlations can vary through time based on a range of conditions including the level of interest rates, the degree of turbulence in financial markets and the performance of major equity markets. Oftentimes, they are characterized by upside diversification and downside unification, which is precisely the opposite of what investors want.
So what should an investor do? We introduce the notion of co-occurrence, which aligns with what investors really care about: whether assets co-move (or not) over an investment horizon. Co-occurrence is the atomic unit of correlation; it is to correlation as a single period return observation is to the standard deviation. Then, we introduce full-scale optimization as a means to build portfolios that implicitly account for the challenges outlined above, and are designed to achieve the kind of diversification that investors really want.


