Insights
Inflation reignites: State Street PriceStats signals a sharp spike

Inflation in the United States jumped to 4 percent in March — the highest level since January 2023 — as the State Street PriceStats index rose 1.4 percent month-over-month, its steepest increase since launching in July 2008.
April 2026
PriceStats enables daily inflation measurement with just a three-day lag, offering timely insights that complement traditional government statistics. It serves as a valuable leading indicator and is especially useful during periods when government releases are delayed or unavailable. Its daily insights are increasingly relevant for policymakers, investors and analysts seeking to track inflation dynamics in real time.
Covering over 27 countries and multiple sectors — including food, health and transportation — State Street PriceStats uses consistent methodologies to ensure its indicators are comparable across geographies, time periods and official data sources.
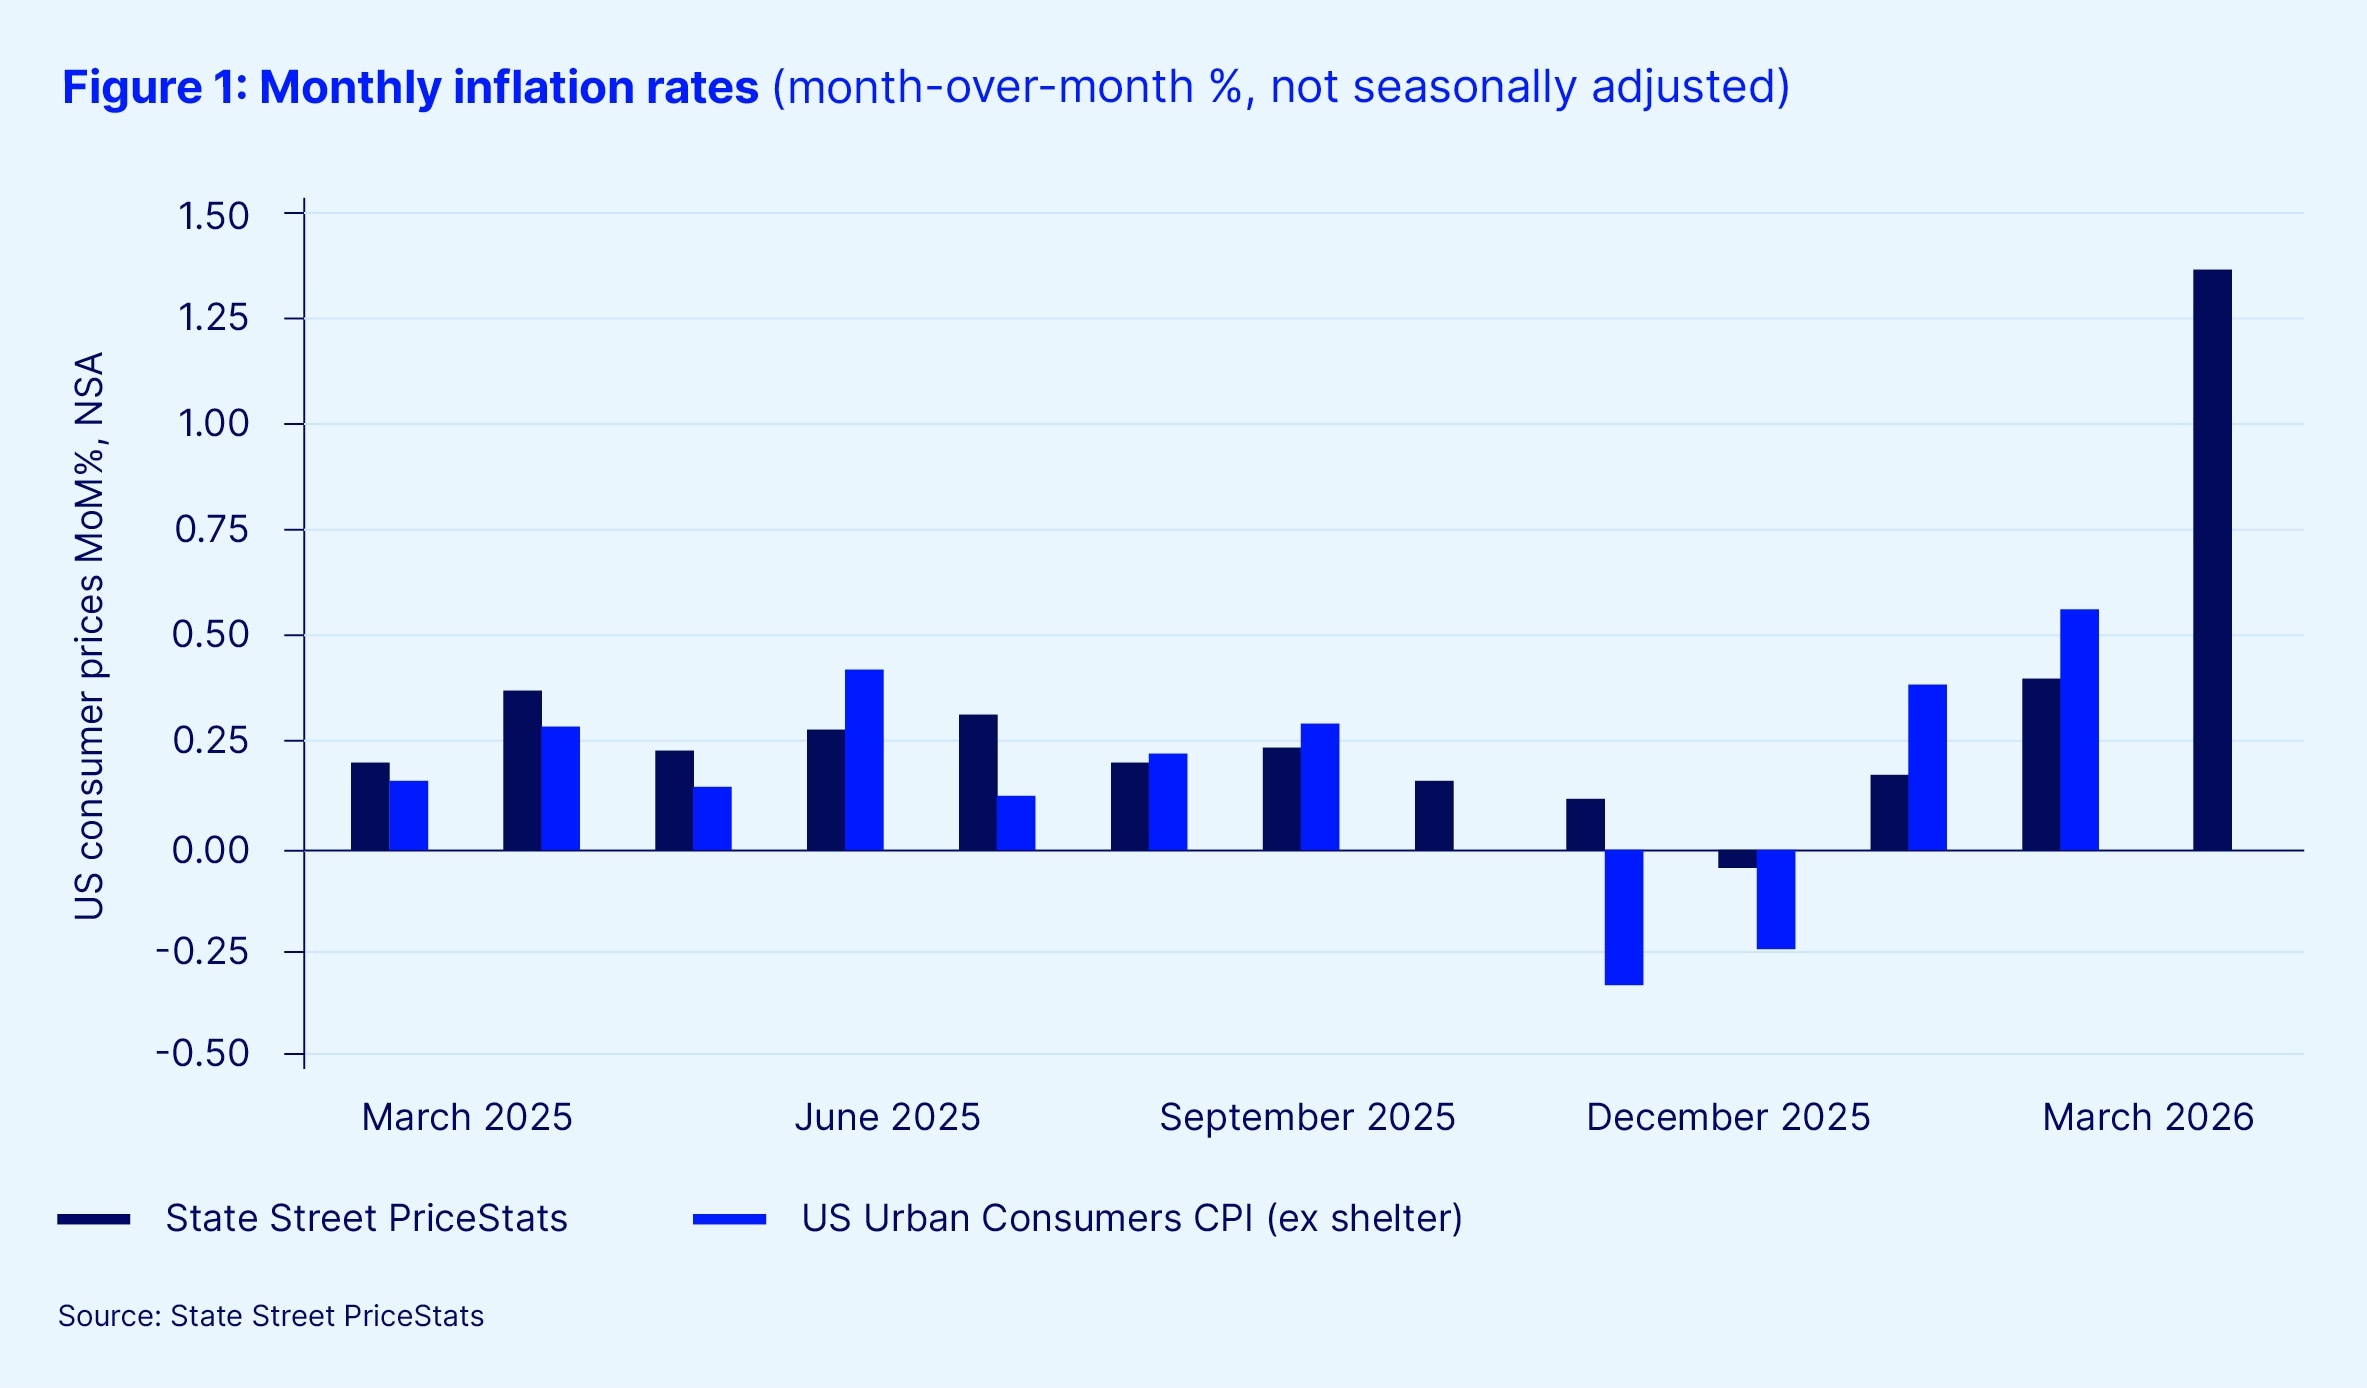

US inflation jumped sharply in March, recording the largest month-over-month increase in prices since at least 2008, when the State Street PriceStats data series began. The spike underscores the thesis advanced by PriceStats cofounder Alberto Cavallo: Large inflation shocks travel fast through the economy, a dynamic he explained during a recent webinar.
In the span of one month, the inflation picture shifted materially. The disinflation trend that emerged in late 2025 has faded, and expectations for a lower inflation rate in 2026 are being reassessed even before the official release of March data.
What happens next will depend largely on energy prices and how quickly those costs filter through to everyday items. Early State Street PriceStats sector data for March point to above-average monthly increases in areas such as recreation, electronics and apparel. For now, energy is driving both headline inflation and uncertainty about the next moves by markets and central banks.
About the State Street PriceStats indicators
The State Street PriceStats series is designed to provide a low-latency and high-frequency view into inflation trends that is comparable to the official Consumer Price Index (CPI). The features of the process are as follows:
- Daily online price collection: PriceStats collects price data daily from over 1,500 multi-line retailers using web scraping technologies, focusing on those with both online and physical stores. Research has shown that retailers tend to adjust online prices first.
- Data structuring and cleaning: Models then clean and standardize raw price data to ensure consistency across more than 40 million products, converting unstructured HTML into structured datasets ready for analysis.
- Categorization and quality checks: State Street PriceStats categorizes prices by economic sectors and sub-sectors, calculates performance statistics, and applies a red-flag system with daily manual checks to resolve data anomalies.
- Index calculation using econometric techniques: State Street PriceStats computes daily inflation statistics using proprietary econometric methods and publishes the results with a three-day lag.
- Retailer and product selection: State Street PriceStats selects retailers based on market share and city presence and includes over 500,000 daily prices — far exceeding the 80,000 monthly prices used by the US Bureau of Labor Statistics.
- Use of CPI weights and no quality adjustments: State Street PriceStats applies official CPI weights where possible and adjusts for online data characteristics, calculating price changes only from consecutive observations of identical products without applying standard quality adjustments.
For more information or to request a demo, visit our State Street PriceStats Solutions page.


