Insights
Inflation persists: PriceStats data shows US prices rising through the fall

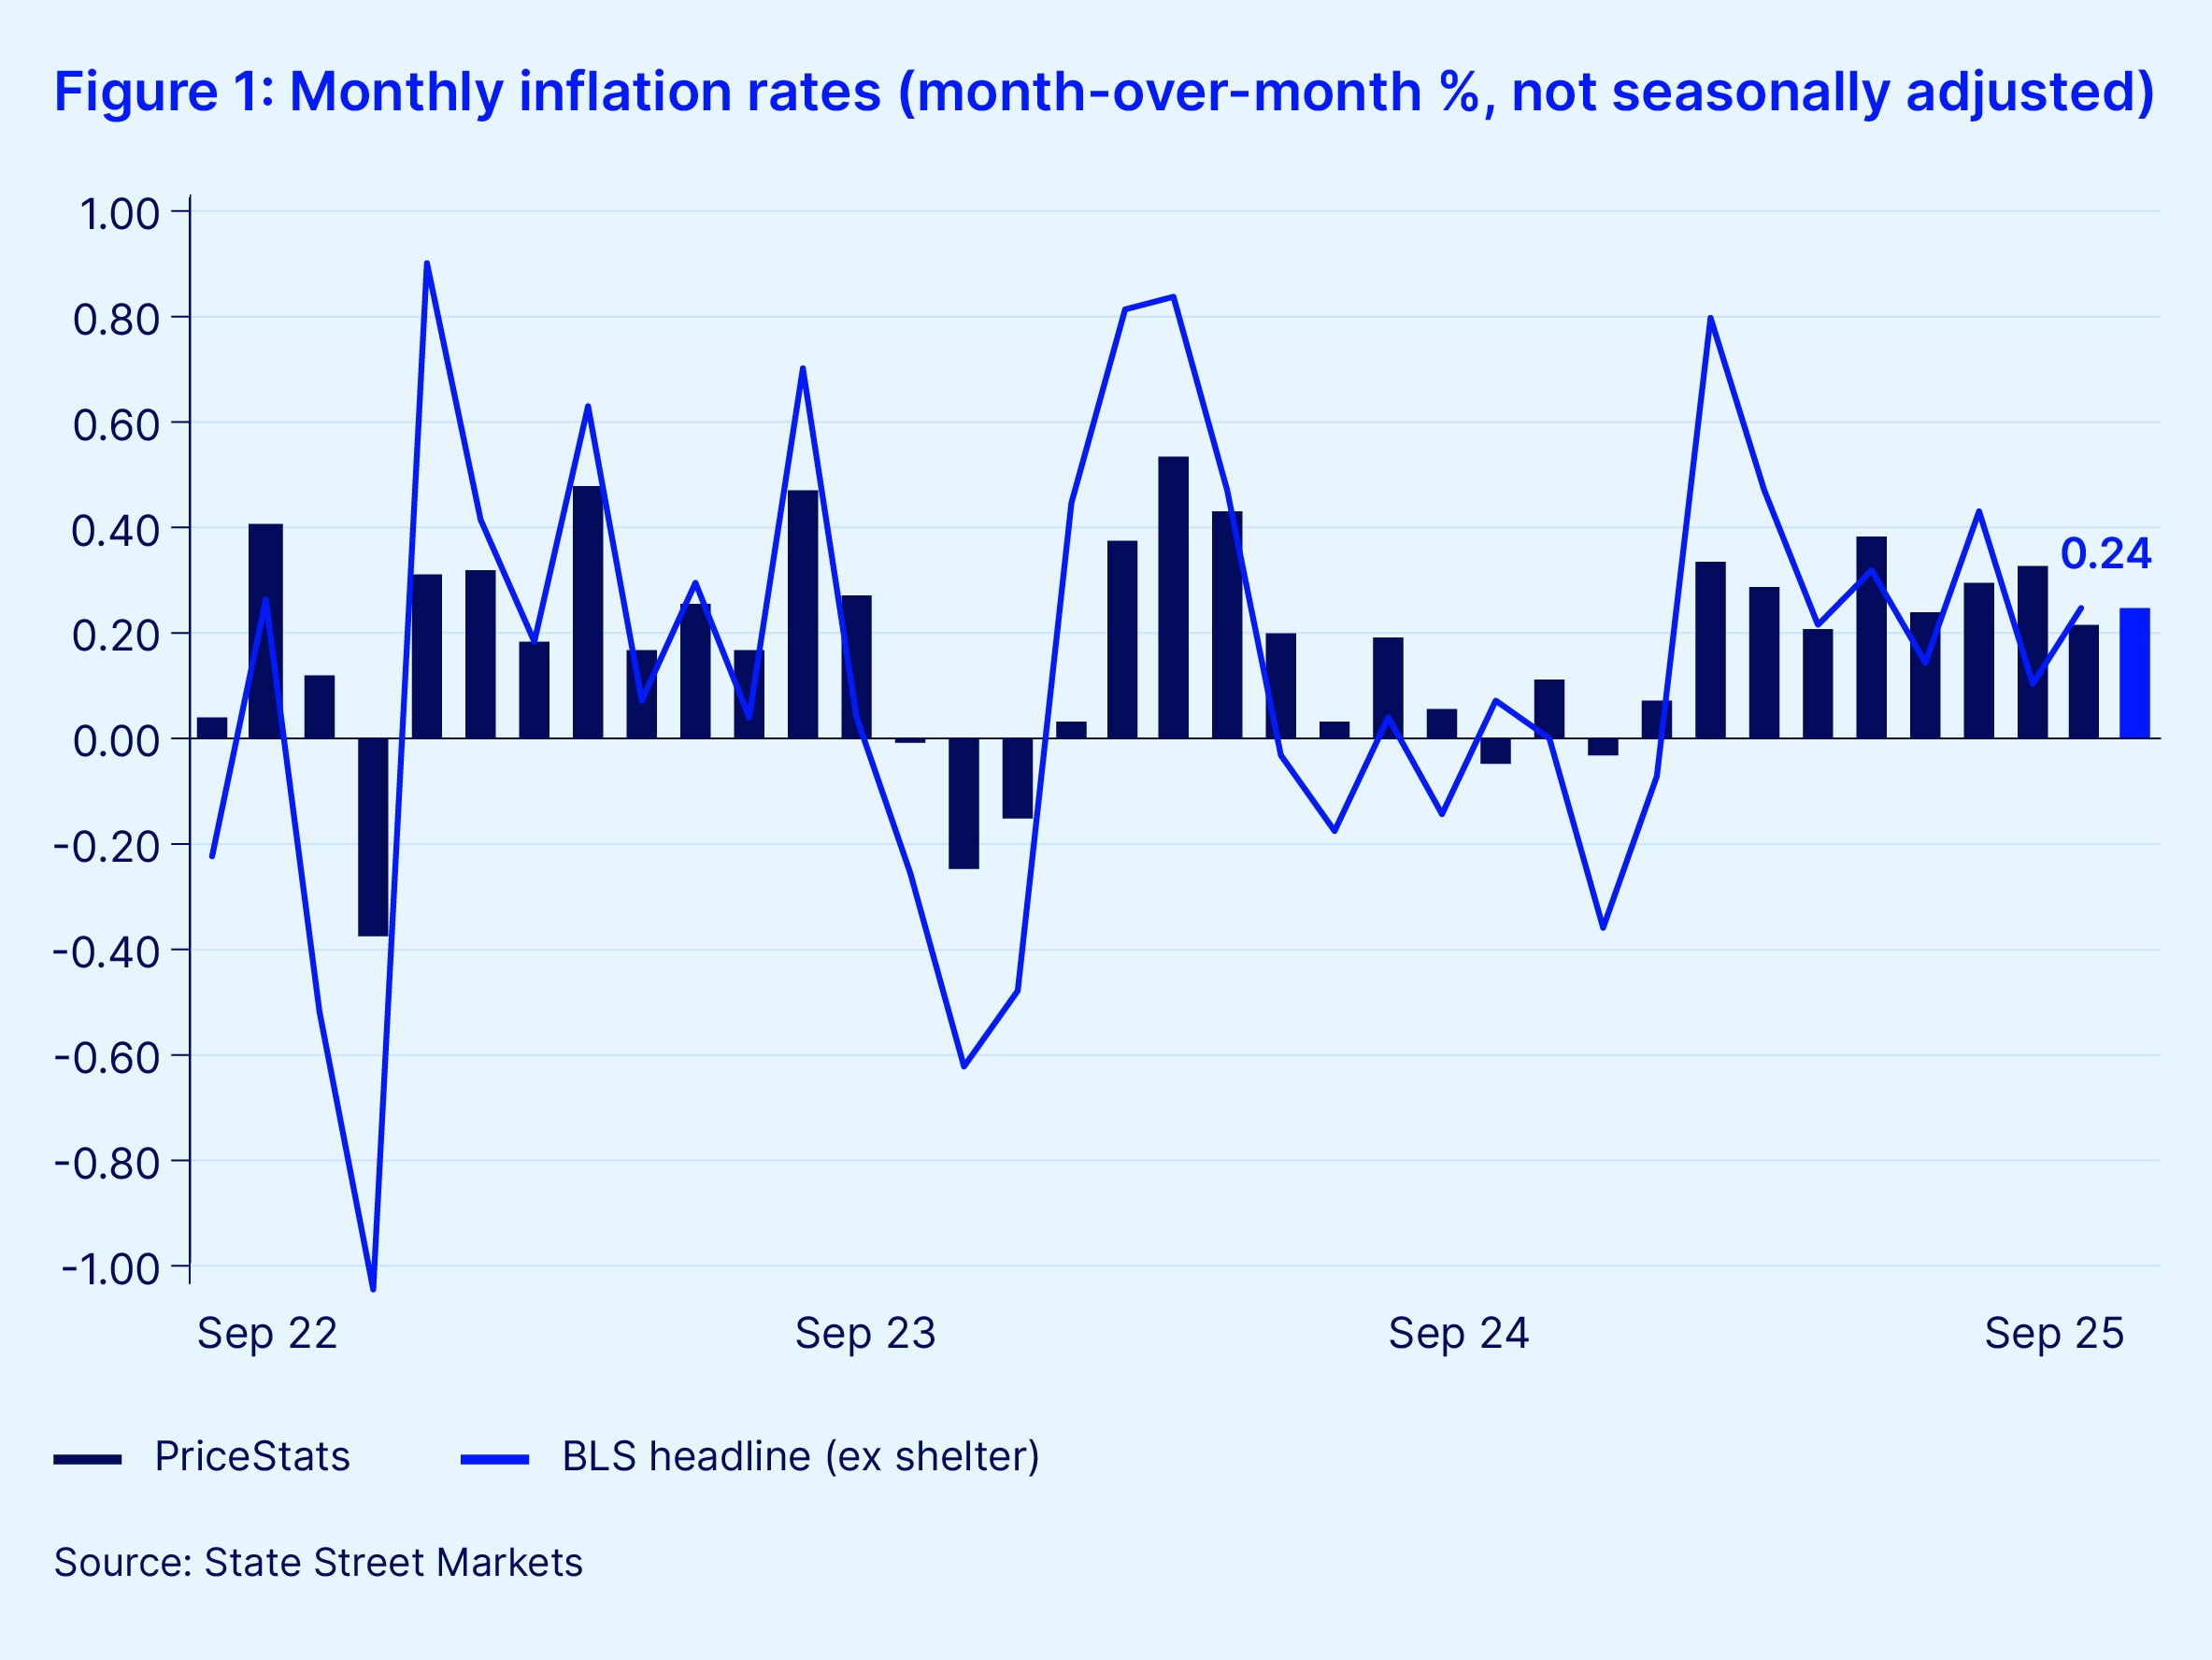
In September, the United States’ PriceStats series rose 0.24 percent on a non-seasonally adjusted basis, closely mirroring August’s 0.21 percent increase. This pushed the annual inflation rate to 2.66 percent, marking its highest level since October 2023.
October 2025
PriceStats enables daily inflation measurement with just a three-day lag, offering timely insights that complement traditional government statistics. It serves as a valuable leading indicator and is especially useful during periods when government releases are delayed or unavailable. Its daily insights are increasingly relevant for policymakers, investors and analysts seeking to track inflation dynamics in real time.
Covering over 25 countries and multiple sectors — including food, health and transportation — PriceStats uses consistent methodologies to ensure its indicators are comparable across geographies, time periods and official data sources.

Continue reading for further commentary by Michael Metcalfe, head of Macro Strategy, State Street Markets:
US inflation remained firm in September, though not alarming. A 0.24 percent increase is notable for September, as it is typically a month of modest price gains. This rise pushed PriceStats’ annual inflation to its highest level this year. Much of the unusual seasonal inflation strength came from household equipment and furniture prices, which include a higher share of imported goods than other sectors. According to PriceStats, the annual inflation rate in this segment has now risen above five percent for the first time since January 2023. The pressure from core goods on inflation has continued.
Outside of this sector, there were also firm readings in both food and transportation prices, but price pressures in apparel and electronics were closer to their norms for the month. Meanwhile, healthcare products registered a modest decline. Together, this suggests that while there are pockets of stronger inflationary pressures, the breadth of price increases remains narrow, suggesting that retailers are still somewhat uncertain about the resilience of consumer demand.
Given that monthly changes in the PriceStats series show a correlation with the US Bureau of Labor Statistics (BLS) inflation measures in excess of 80 percent over the past five years, this data should serve as a reliable guide for policy makers, consumers and financial market participants if official data is not released.
For now, PriceStats data suggests the uptrend aligns with the Fed’s and forecasters' projections for higher inflation into year-end. But this still requires careful monitoring for signs of acceleration as we move into the seasonal discounting season. If the current trend in inflation does not show its normal softening ahead of the US holidays, it could once again challenge hopes for further interest rate cuts.
To hear more from our experts and academic partners on this topic, tune in to our recent Street Signals podcast.
For more information or to request a demo, please contact dataintelligence@statestreet.com.
About the PriceStats indicators
The PriceStats series are designed to provide a low-latency and daily view into inflation trends that is comparable to the official Consumer Price Index (CPI). The features of the process are as follows:
- Daily online price collection: PriceStats collects price data daily from over 1,500 multi-line retailers using web scraping technologies, focusing on those with both online and physical stores. Research has shown that retailers tend to adjust online prices first.
- Data structuring and cleaning: Models then clean and standardize raw price data to ensure consistency across more than 40 million products, converting unstructured HTML into structured datasets ready for analysis.
- Categorization and quality checks: PriceStats categorizes prices by economic sectors and sub-sectors, calculates performance statistics and applies a red-flag system with daily manual checks to resolve data anomalies.
- Index calculation using econometric techniques: PriceStats computes daily inflation statistics using proprietary econometric methods and publishes the results with a three-day lag.
- Retailer and product selection: PriceStats selects retailers based on market share and city presence and includes over 800,000 daily prices — comprising a broader basket than the monthly prices used by the BLS.
- Use of CPI weights and no quality adjustments: PriceStats applies official CPI weights where possible and adjusts for online data characteristics, calculating price changes only from consecutive observations of identical products — without applying standard quality adjustments.


