Insights
State Street PriceStats data: Still no peak?

November’s rise in US inflation, as measured by State Street PriceStats, diverged slightly from typical seasonal patterns and may inform year-end economic assessments.
December 2025
November data from the United States State Street PriceStats series rose 0.12 percent on a non-seasonally adjusted basis, continuing up from the 0.16 percent bump in October (see Figure 1) and pushing the PriceStats annual inflation rate up two-tenths of a percentage point to 2.9 percent — its highest rate since March 2023 (see Figure 2).
State Street PriceStats uses web-scraping technology to track millions of online retail prices, enabling daily inflation measurement with only a three-day lag. Covering more than 27 countries and multiple sectors — from food and health to transportation — State Street PriceStats applies consistent methodologies to ensure comparability across time, geographies and official data sources. While alternative sources of economic data like State Street PriceStats are not a substitute for official government statistics, they serve as valuable leading indicators, particularly when government data is delayed or is unavailable.
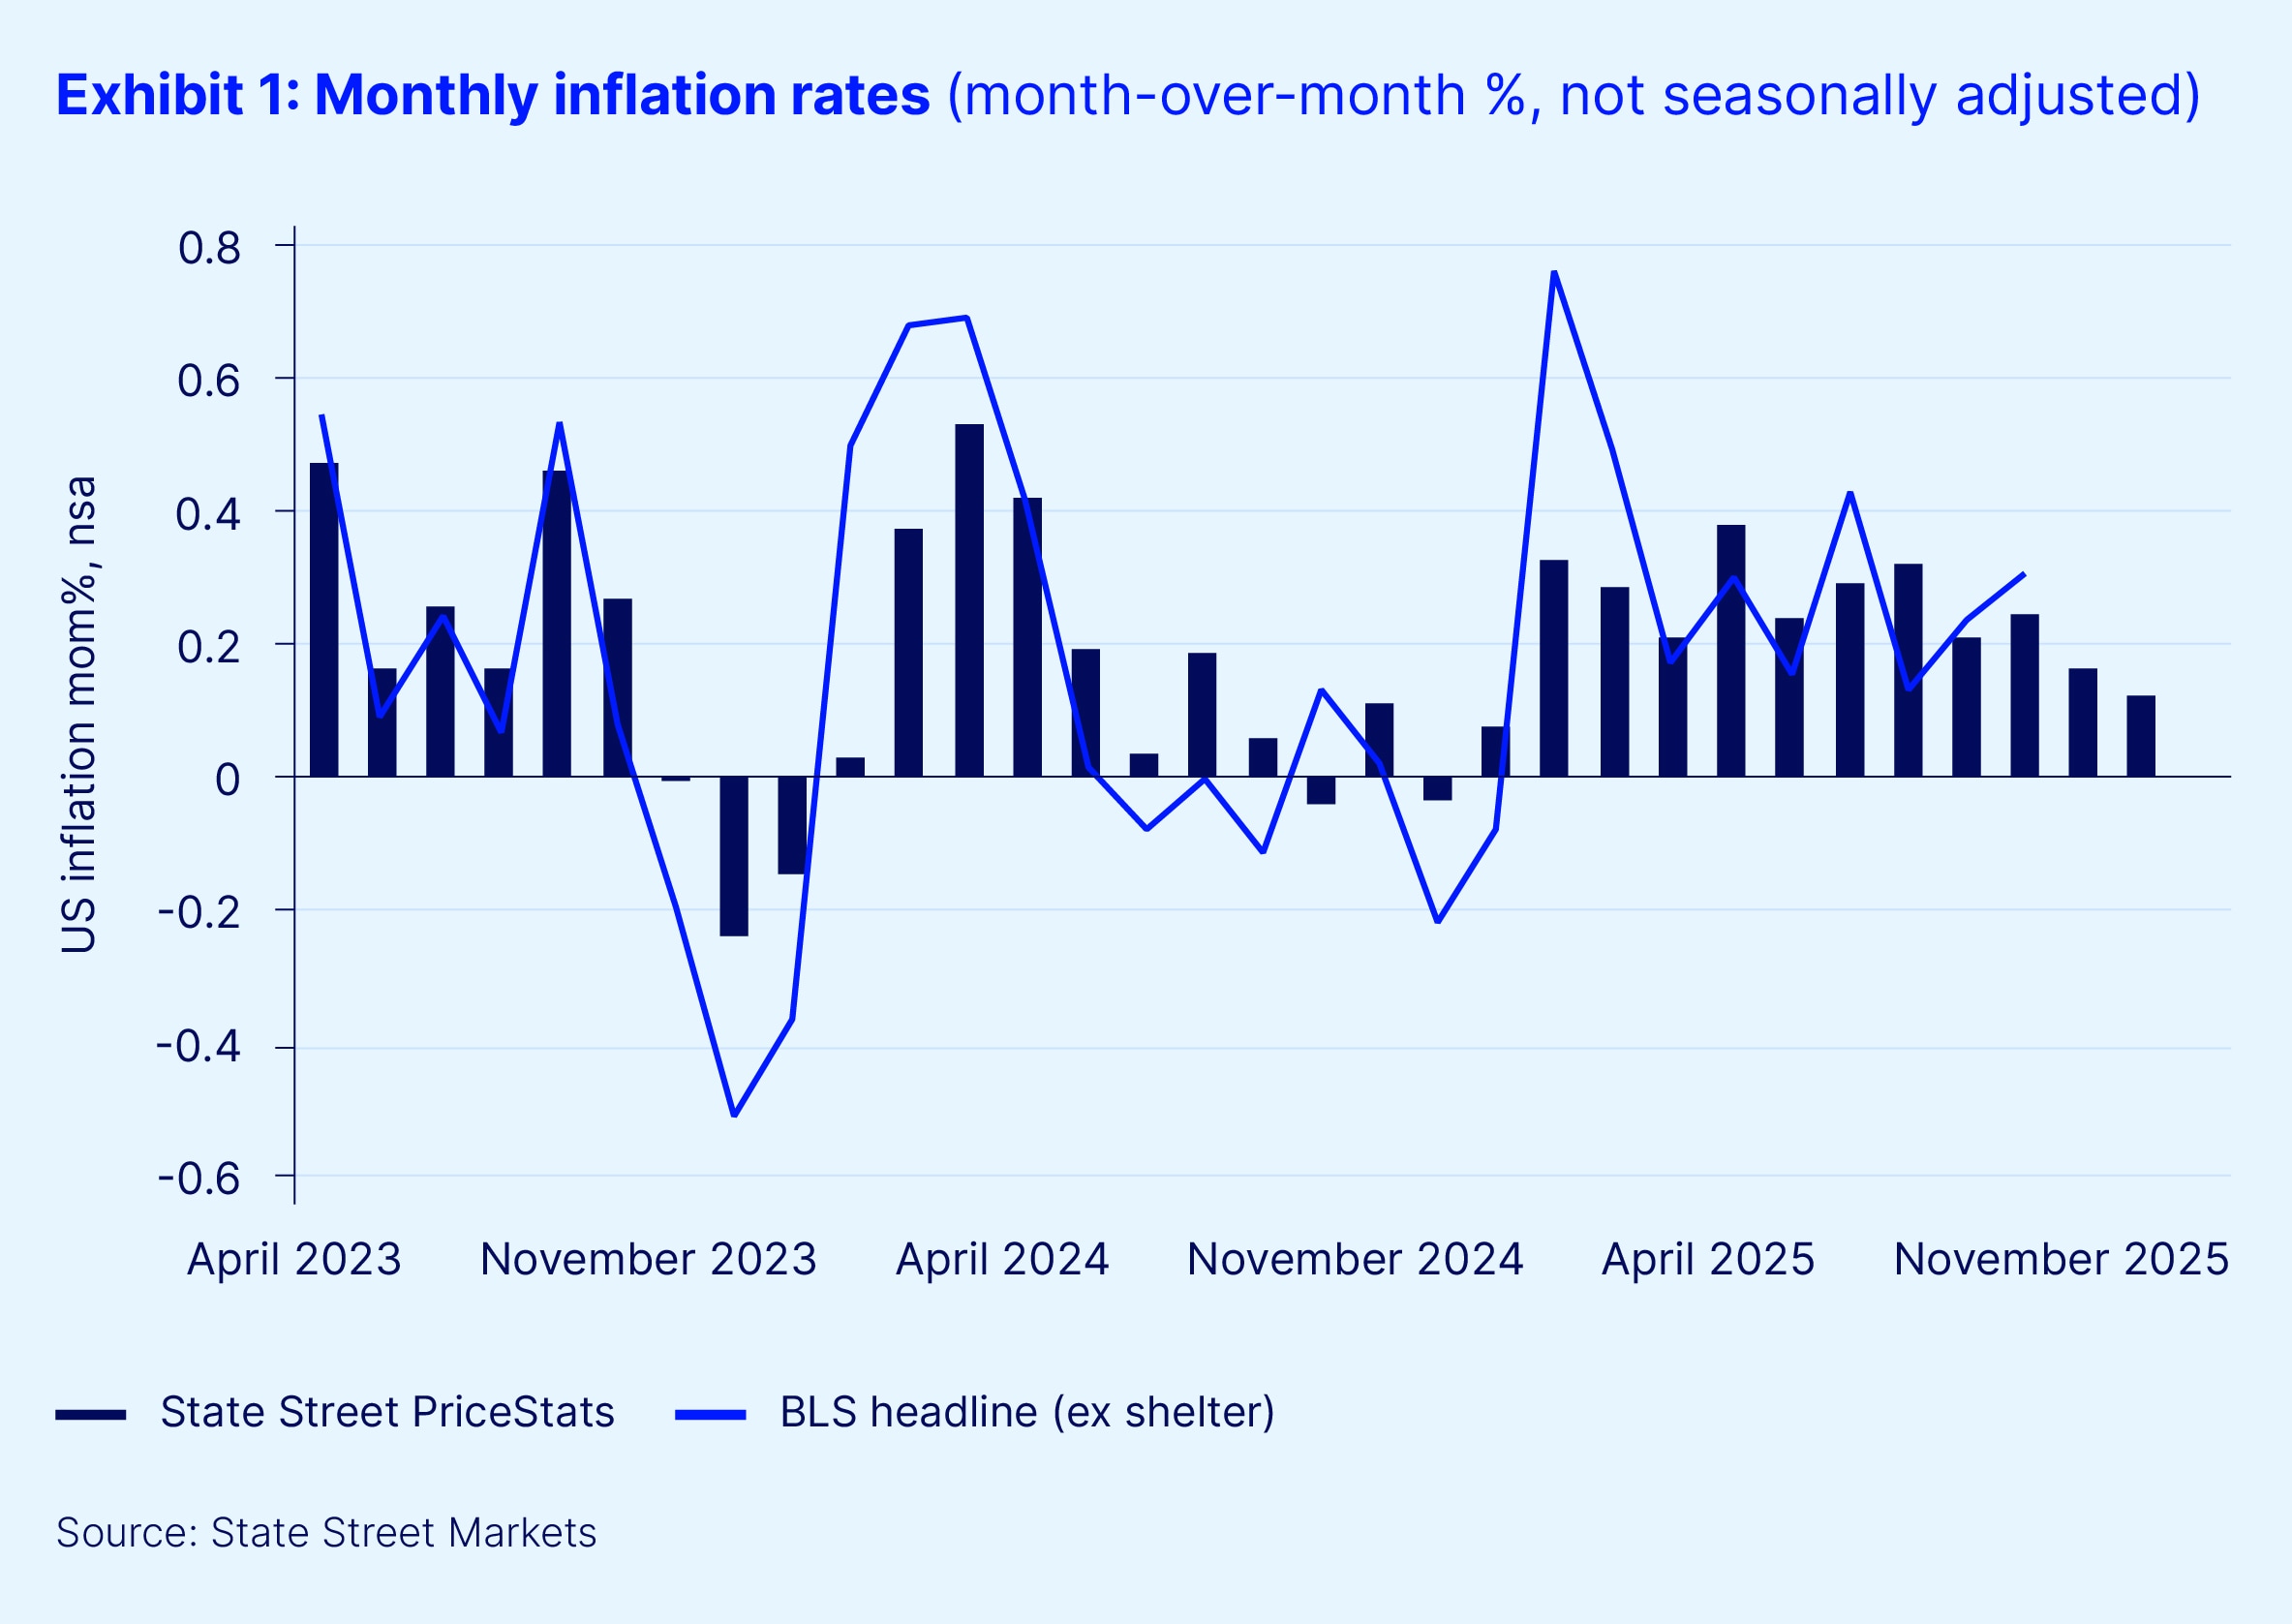

The US price level rose just over 10 basis points in November. While not a large jump, in a month where prices are flat-to-down on average due to seasonal discounting, it is slightly firmer than normal and certainly firmer than in 2024. Having remained unchanged in October, the State Street PriceStats annual inflation rate has begun to rise once again, reaching 2.9 percent.
Looking beneath the headline, the State Street PriceStats measure sector series was a bit more benign this month. The November 2024 fall in gas prices was not replicated in 2025, resulting in much of the jump in the annual inflation rate. Meanwhile, the prices of household equipment and furniture sectors (which typically have a higher share of imported goods) were unchanged in the month, leading to the nearest-to-normal seasonal trend for this sector we’ve seen in a year. Added to a 0.5 percent month-over-month (MoM) fall in the prices of electronic goods and a below-average monthly gain for apparel, there is a hint that tariff pass-through into goods prices is finally normalizing and that the inflation trend is approaching its peak.
As we noted in September and October, given that monthly changes in the State Street PriceStats series show a correlation with US Bureau of Labor Statistics (BLS) inflation measures in excess of 80 percent over the past five years, this data should serve as a reliable guide for policymakers, consumers and financial market participants as we await the publication of official November data on December 18. In September (the last official data available), our reported annual inflation rate was within one basis point of the delayed BLS annual inflation rate (ex-shelter).
State Street PriceStats data compiled since then implies a modest upside risk to the annual inflation rate but with more benign underlying detail, suggesting that forecasters' projections for inflation into year-end (including those of the Federal Reserve) will remain broadly intact. This means that the current inflation trend is unlikely to disrupt continued expectations for further Fed easing.
About the State Street PriceStats daily inflation indices
The State Street PriceStats inflation series are designed to provide a low-latency and near real-time view into inflation trends that is comparable to the official Consumer Price Index (CPI). The features of the process are as follows:
- Daily online price collection: State Street PriceStats collects price data daily from over 1,500 multi-line retailers using web-scraping technologies, focusing on those with both online and physical stores. Research has shown that retailers tend to adjust online prices first.
- Data structuring and cleaning: Models then clean and standardize raw price data to ensure consistency across more than 40 million products, converting unstructured HTML into structured datasets ready for analysis.
- Categorization and quality checks: State Street PriceStats categorizes prices by economic sectors and sub-sectors, calculates performance statistics and applies a red-flag system with daily manual checks to resolve data anomalies.
- Index calculation using econometric techniques: State Street PriceStats computes daily inflation statistics using proprietary econometric methods and publishes the results with a three-day lag.
- Retailer and product selection: State Street PriceStats selects retailers based on market share and city presence, and includes over 500,000 daily prices — far exceeding the 80,000 monthly prices used by the BLS.
- Use of CPI weights and no quality adjustments: State Street PriceStats applies official CPI weights where possible and adjusts for online data characteristics, calculating price changes only from consecutive observations of identical products — without applying standard quality adjustments.


