Insights
Market Signals and Shifts: What to watch in 2026
What's inside

Our award-winning research team draws on State Street’s proprietary data to address pressing questions shaping global markets in 2026.

Tony Bisegna
Head of State Street Markets
Our second annual State Street Markets outlook, Market Signals and Shifts: What to watch in 2026, examines the dominant forces shaping the year ahead through a lens that challenges consensus thinking.
The outlook draws on the work of our award-winning research team and focuses on understanding investor behavior, regional risk dynamics and how signals evolve when markets move away from historic norms. By combining State Street’s suite of proprietary indicators — including a novel prediction methodology — and applying new artificial intelligence (AI) tools to our data, we’re bringing greater clarity to a fast-shifting market landscape that has become difficult to interpret with traditional frameworks alone. This approach is further explained by David Turkington, head of State Street Associates, in the accompanying video below.
At its core, Market Signals and Shifts: What to watch in 2026 is designed to address the most consequential questions investors are grappling with this year. Rather than a point forecast, these insights can reveal market shifts and momentum changes ahead of the broader narrative.
Read our experts’ commentary to learn:
- Why institutional investor asset allocation precedents are troubling
- Whether US equities can continue their long run of outperformance
- What AI and alternative data can tell us about interest rate markets
- Whether the US dollar can bounce back from its worst decline in almost a decade
- Why emerging markets should be reconsidered
As the investment landscape grows more complex, our experienced research team remains focused on helping investors make sense of the signals and shifts across global markets with an eye toward identifying new opportunities and preparing for volatility.
We hope you find this outlook useful, and we look forward to providing you with periodic updates in the year ahead.
Troubling asset allocation precedents
Megan Czasonis, head of Portfolio Management Research, State Street Associates
Michael Metcalfe, head of Macro Strategy, State Street Markets
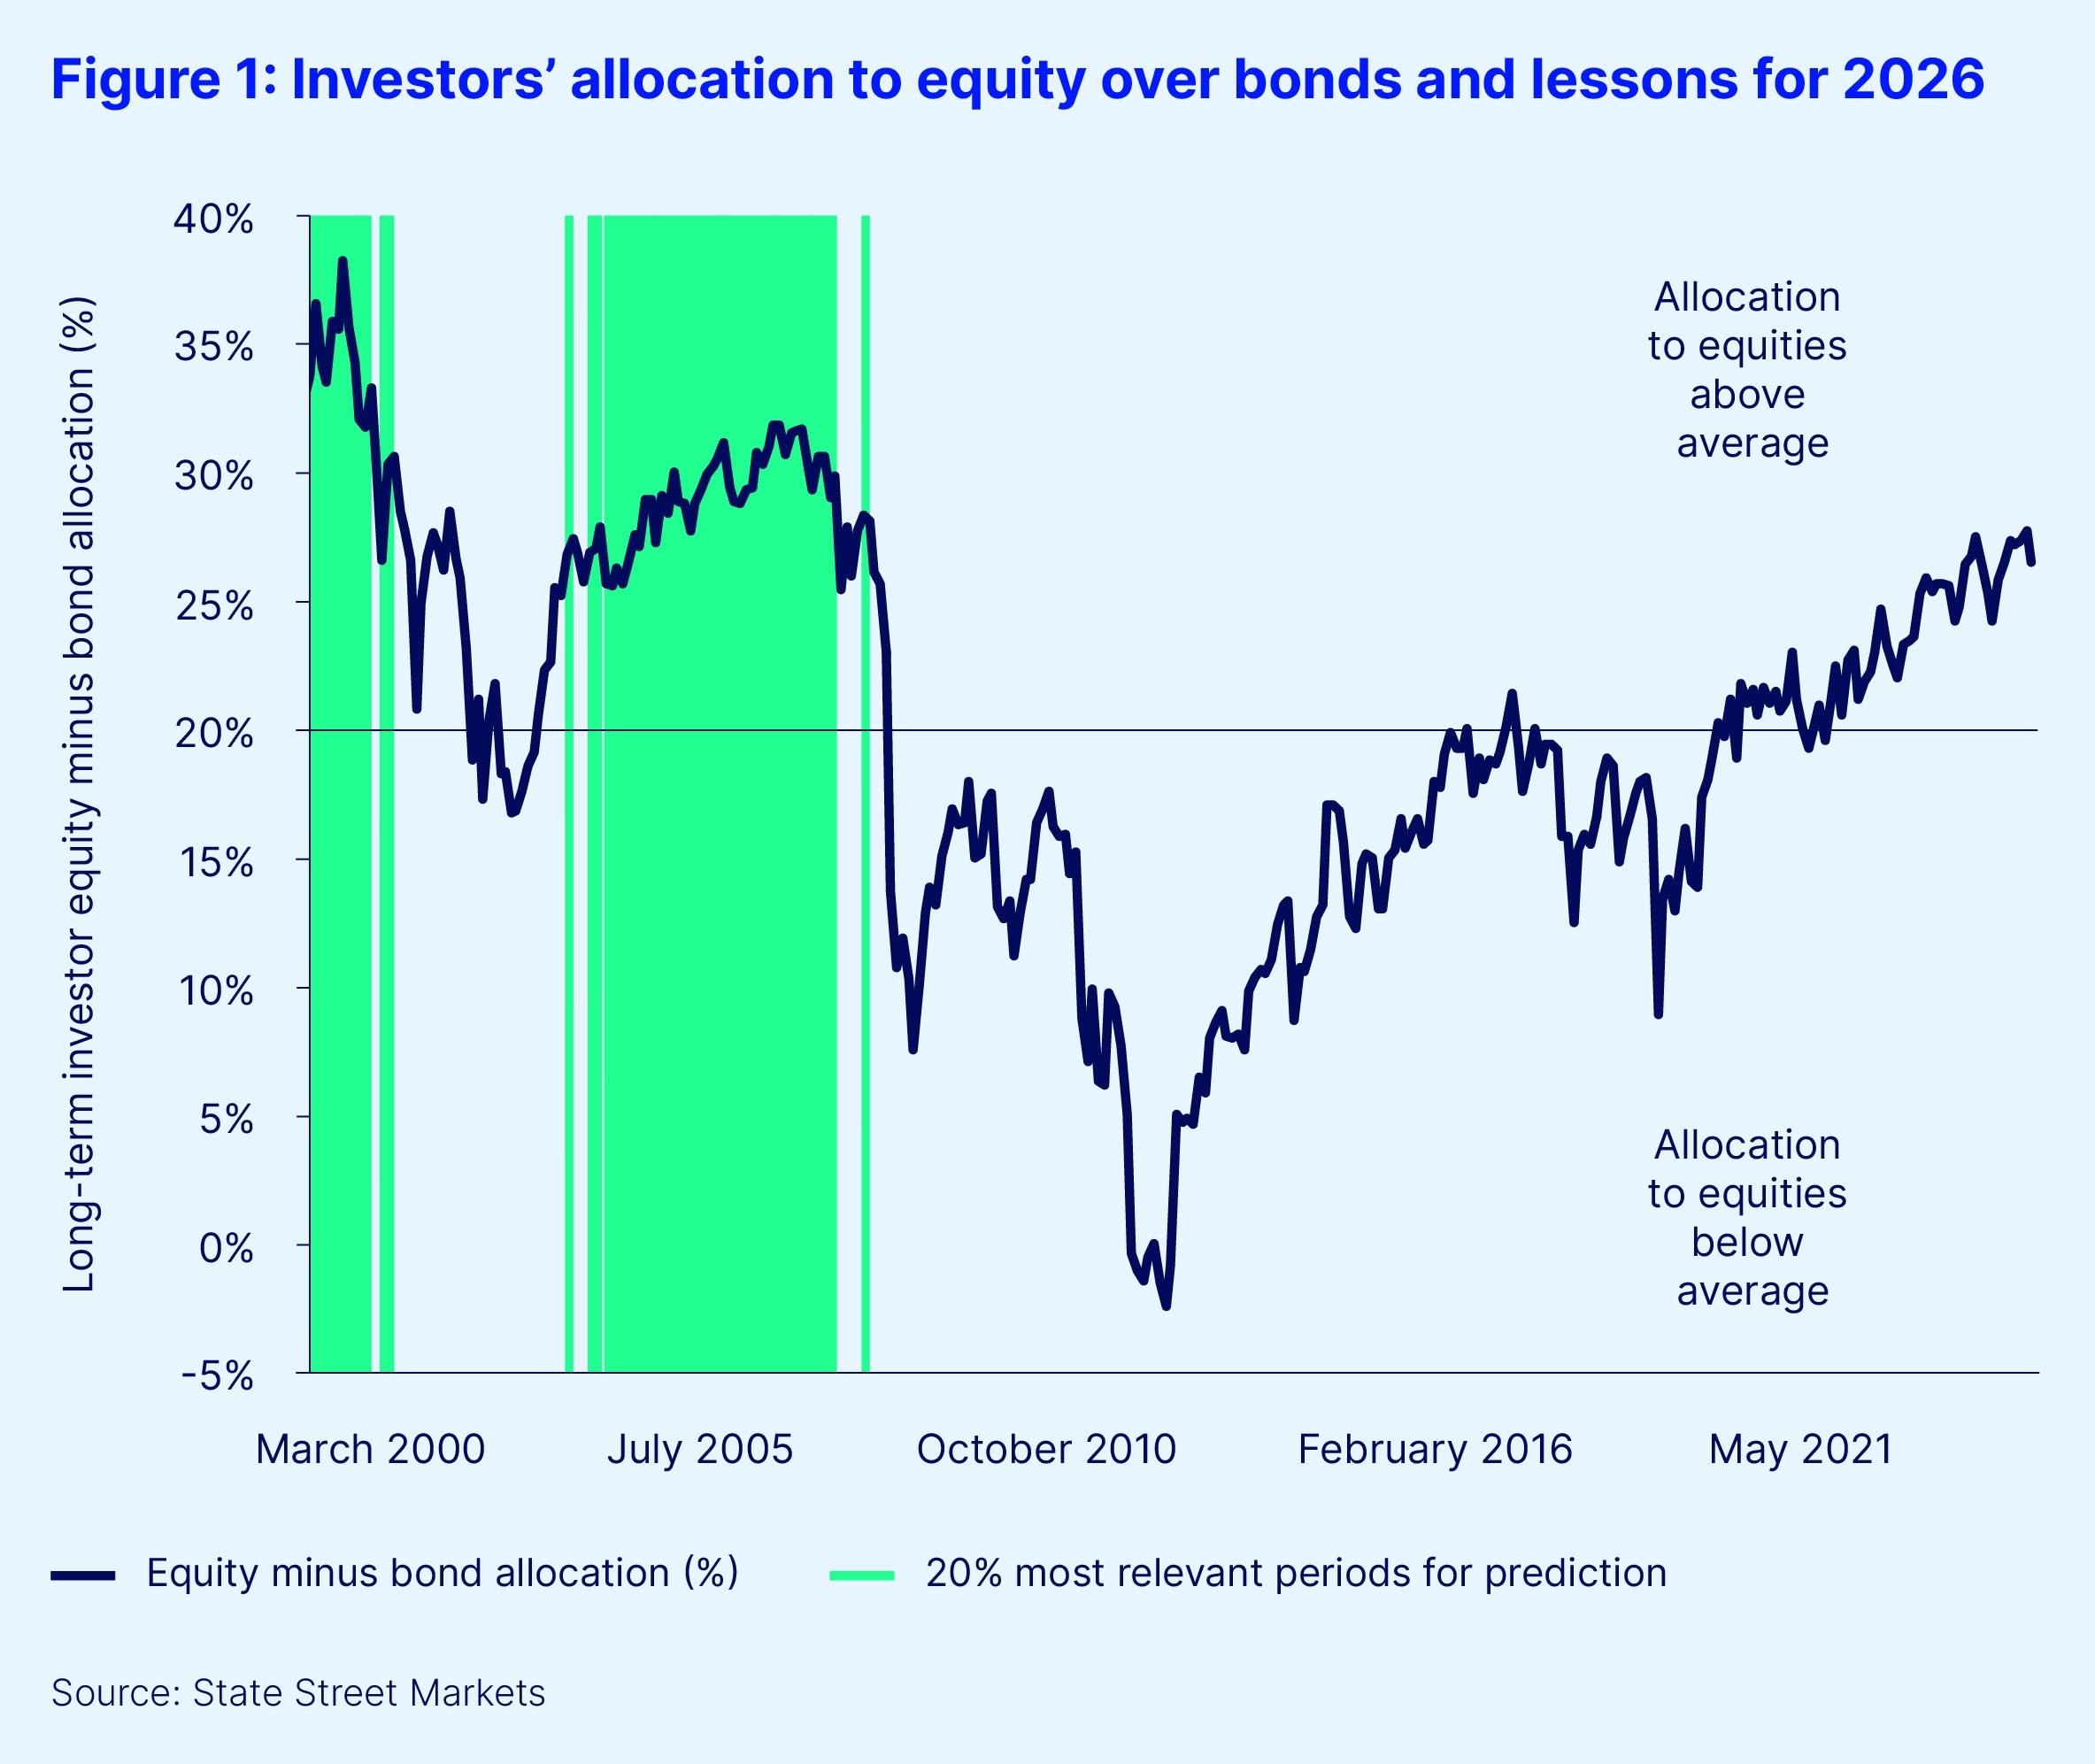
In our 2025 edition of What to watch, we highlighted institutional investors’ overall portfolio allocation as a key issue for markets. This may be even more important in 2026 as investors continue to allocate a historically high percentage of their overall portfolios to equities, relative to bonds.
According to our indicators of institutional investor behavior, over the past 25 years the average allocation to equities has been about 20 percent above the allocation to fixed income. This is in line with the traditional portfolio theory of 60/40 equity/bond allocation. But as we begin 2026, that 20 percent over-allocation to equities is above 28 percent — a 15-year high reached this past October.
Such unusually inflated levels of optimism about equities, especially in the face of unprecedented macro policy uncertainty and a fundamental reorganization of the global economy, have been largely vindicated over the past 12 months. One might assume that having passed the stress tests of 2025, confidence for 2026 should be even higher. Nevertheless, episodes of equity market volatility since peak optimism in October are a reminder that with such elevated levels of equity holdings comes added market vulnerability.
What do high equity allocations mean for returns in 2026?
Using our novel Relevance-Based Prediction (RBP) technology,1 we can explore what typically happens to relative equity-bond returns following time periods with high equity-to-bond portfolio allocations. By analyzing and extrapolating from the most relevant past experiences, RBP generates a future projection. In the process, it can capture complex relationships in a transparent way.
Two things are immediately striking about the top 20 percent of periods that were selected as most relevant to investors’ current equity overweight (see Figure 1). First, there is no recent precedent (in the past decade). Second, the existing precedents are clustered between July 1999 and May 2001, at the peak of the dot-com bubble, and then again between August 2004 and June 2008, during the housing bubble and the Great Financial Crisis.
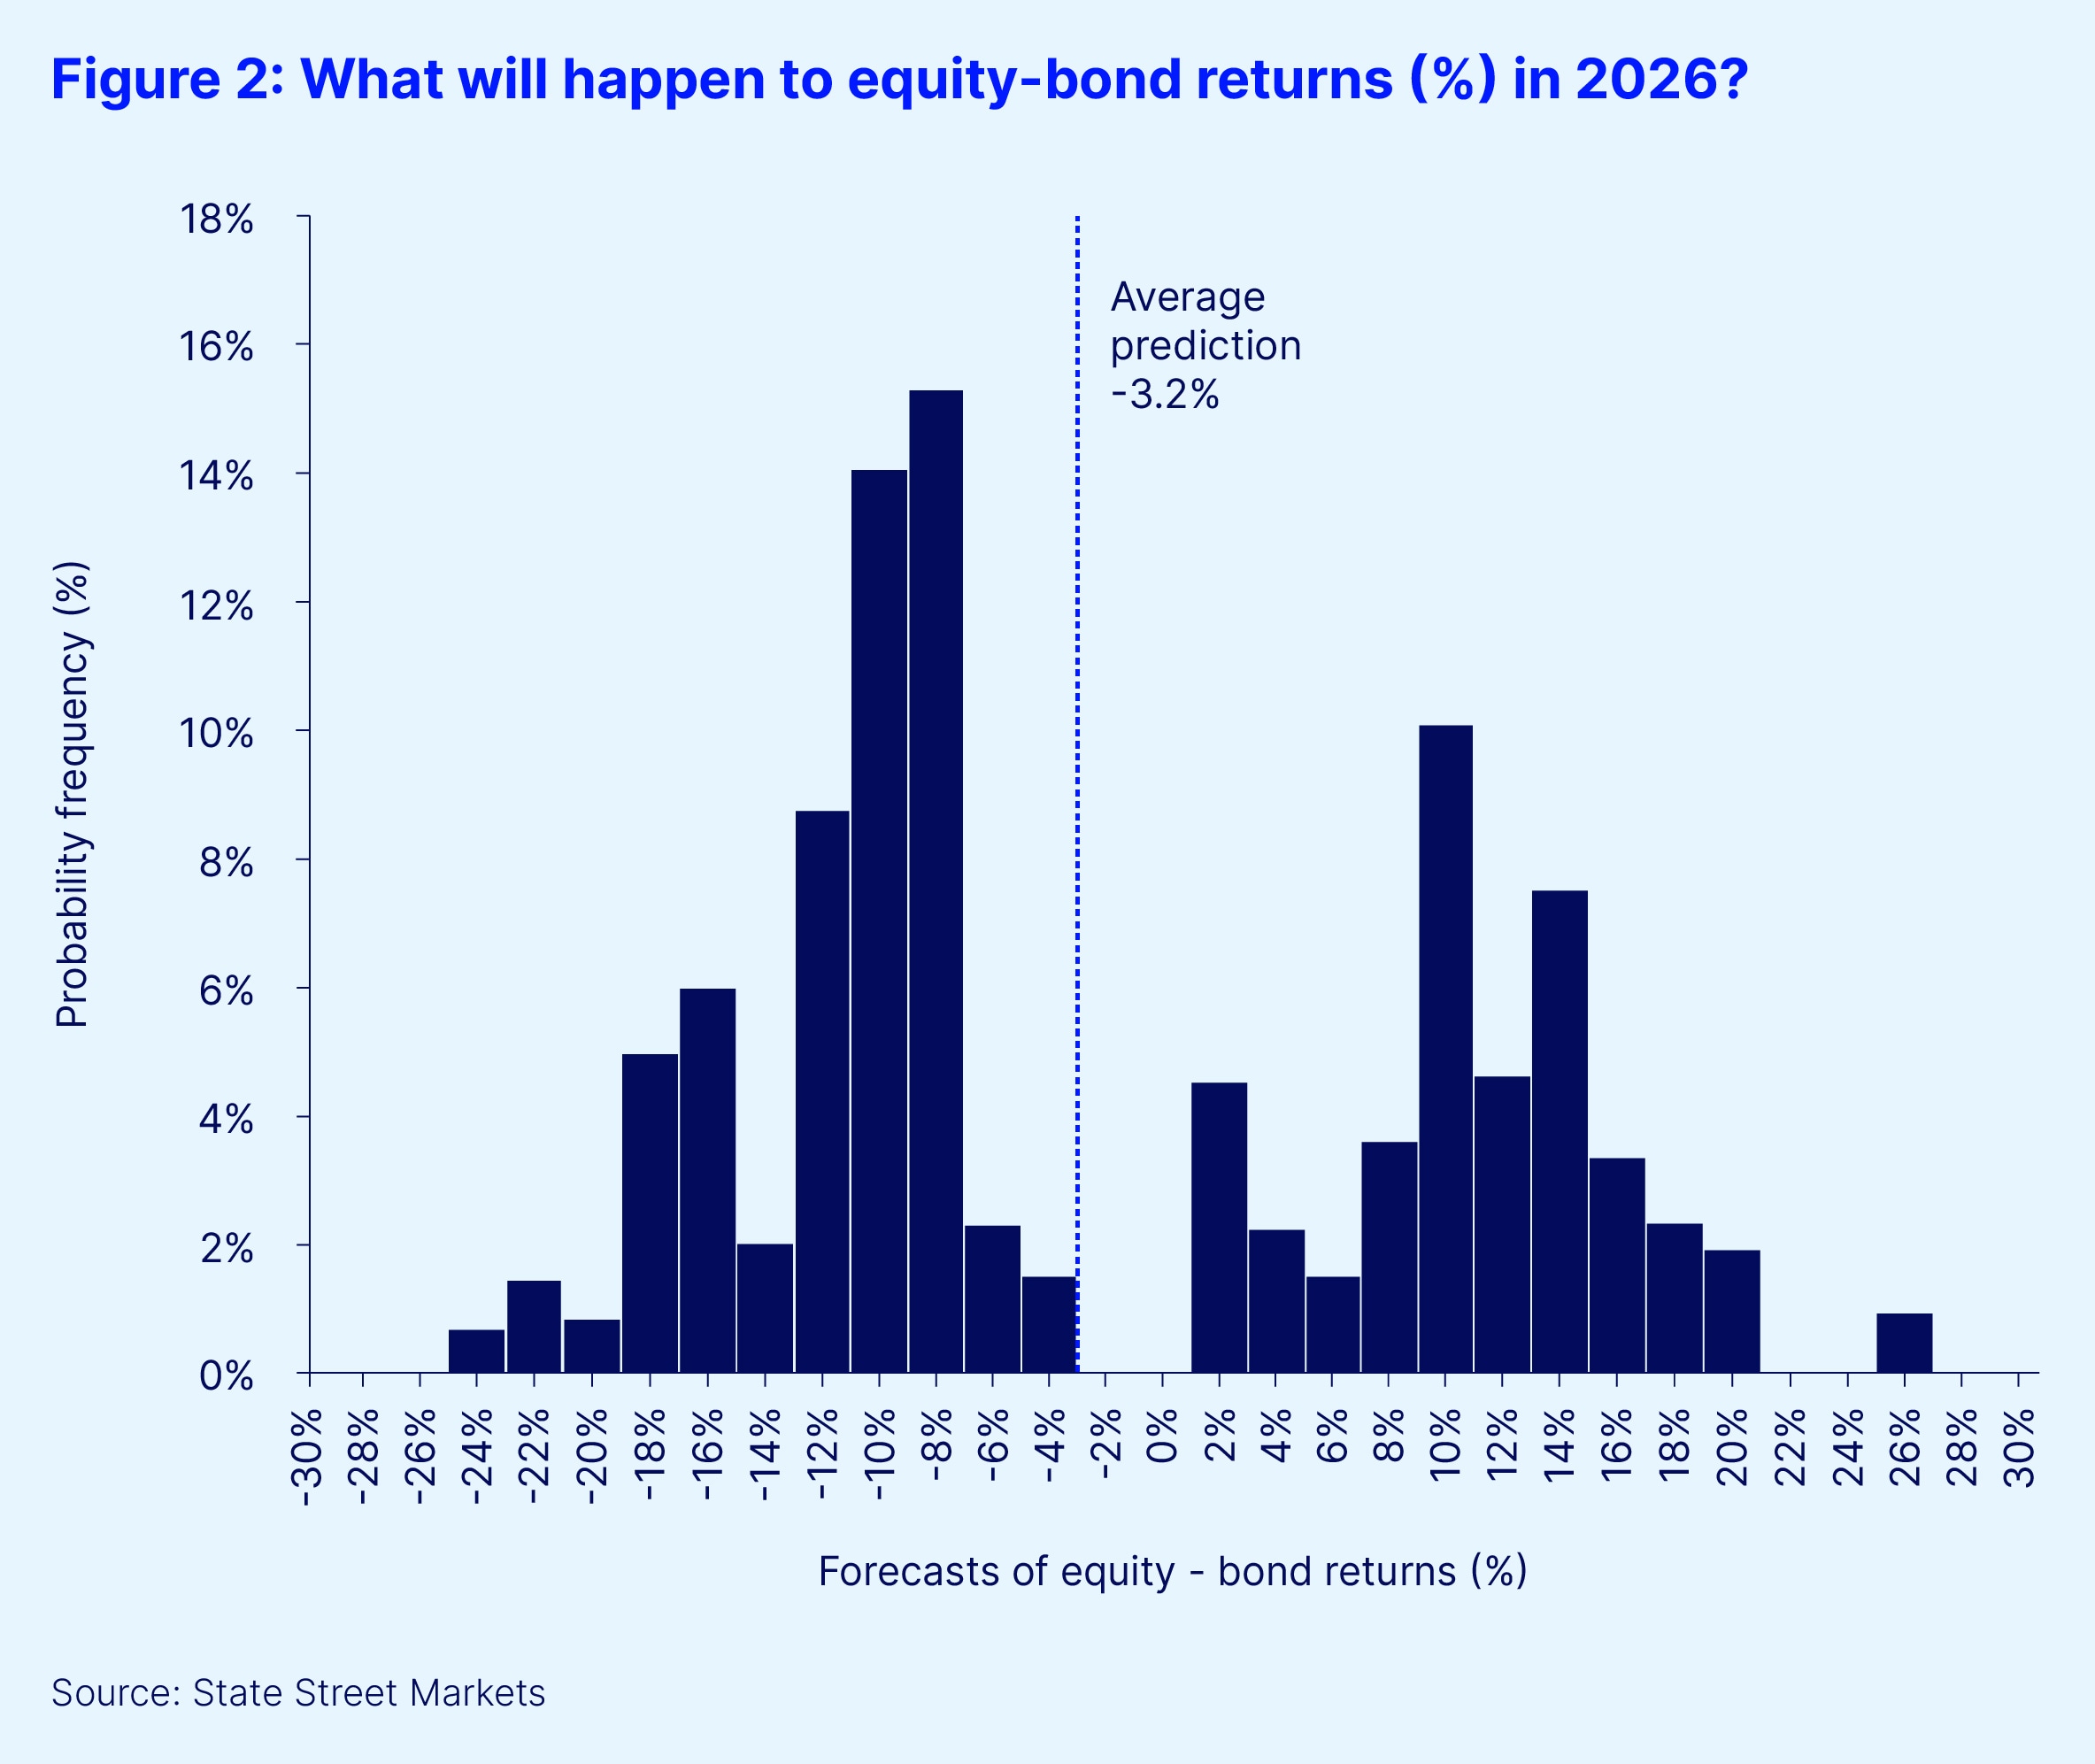
An important takeaway from these relevant periods is that they include both the build-up to the crises, when equity returns were strong, and the eventual market crashes themselves. This is reflected in the range of equity-bond return predictions generated by RBP from each month in these relevant time periods. These individual or “solo” predictions represent each month’s “vote” for how equities will perform in 2026. An average of all these forecasts suggests that equities may underperform bonds by 3.2 percent in the coming 12 months (see Figure 2). Interestingly, the solo predictions are split between very negative and very positive votes, indicating a high degree of uncertainty.
Don’t expect business as usual in 2026
At first glance, this looks like a rather unusual way to begin a year-ahead outlook. The bimodal outcome looks to be the statistical equivalent of the famed “two-handed economist.” And we note that it is very different from consensus expectations, which largely forecast an average year for equity and fixed-income returns.
But it is in keeping with typical market outcomes during a calendar year, when mean returns are rarely observed and outliers regularly feature. In a recent episode of the Street Signals podcast, David Dredge, CIO of hedge fund Convex Strategies noted, “The annual returns of the Standard & Poor’s 500, going back to 1929 are 7.9 percent. And the frequency of that average is three times…in 96 years. Three times. The standard deviation is 18.8 percent. What’s driving the returns? The mean or the variance? Obviously, the variance, massively.”
This view reinforces the main takeaway from our analysis: When allocations to equities are so high, what follows is never average. The implications are profound. In 2026, investors need to prepare for a range of outcomes and be ready to hedge accordingly, whether it be through country, sector, asset, foreign exchange (FX) tilts or by employing multi-asset and alternative strategies to boost portfolio resilience. We’ll explore some of these options in the following articles covering the outlook for equities, fixed income, currencies and emerging markets.
Is US equity dominance coming to an end?
Marija Veitmane, head of Equity Research, State Street Markets
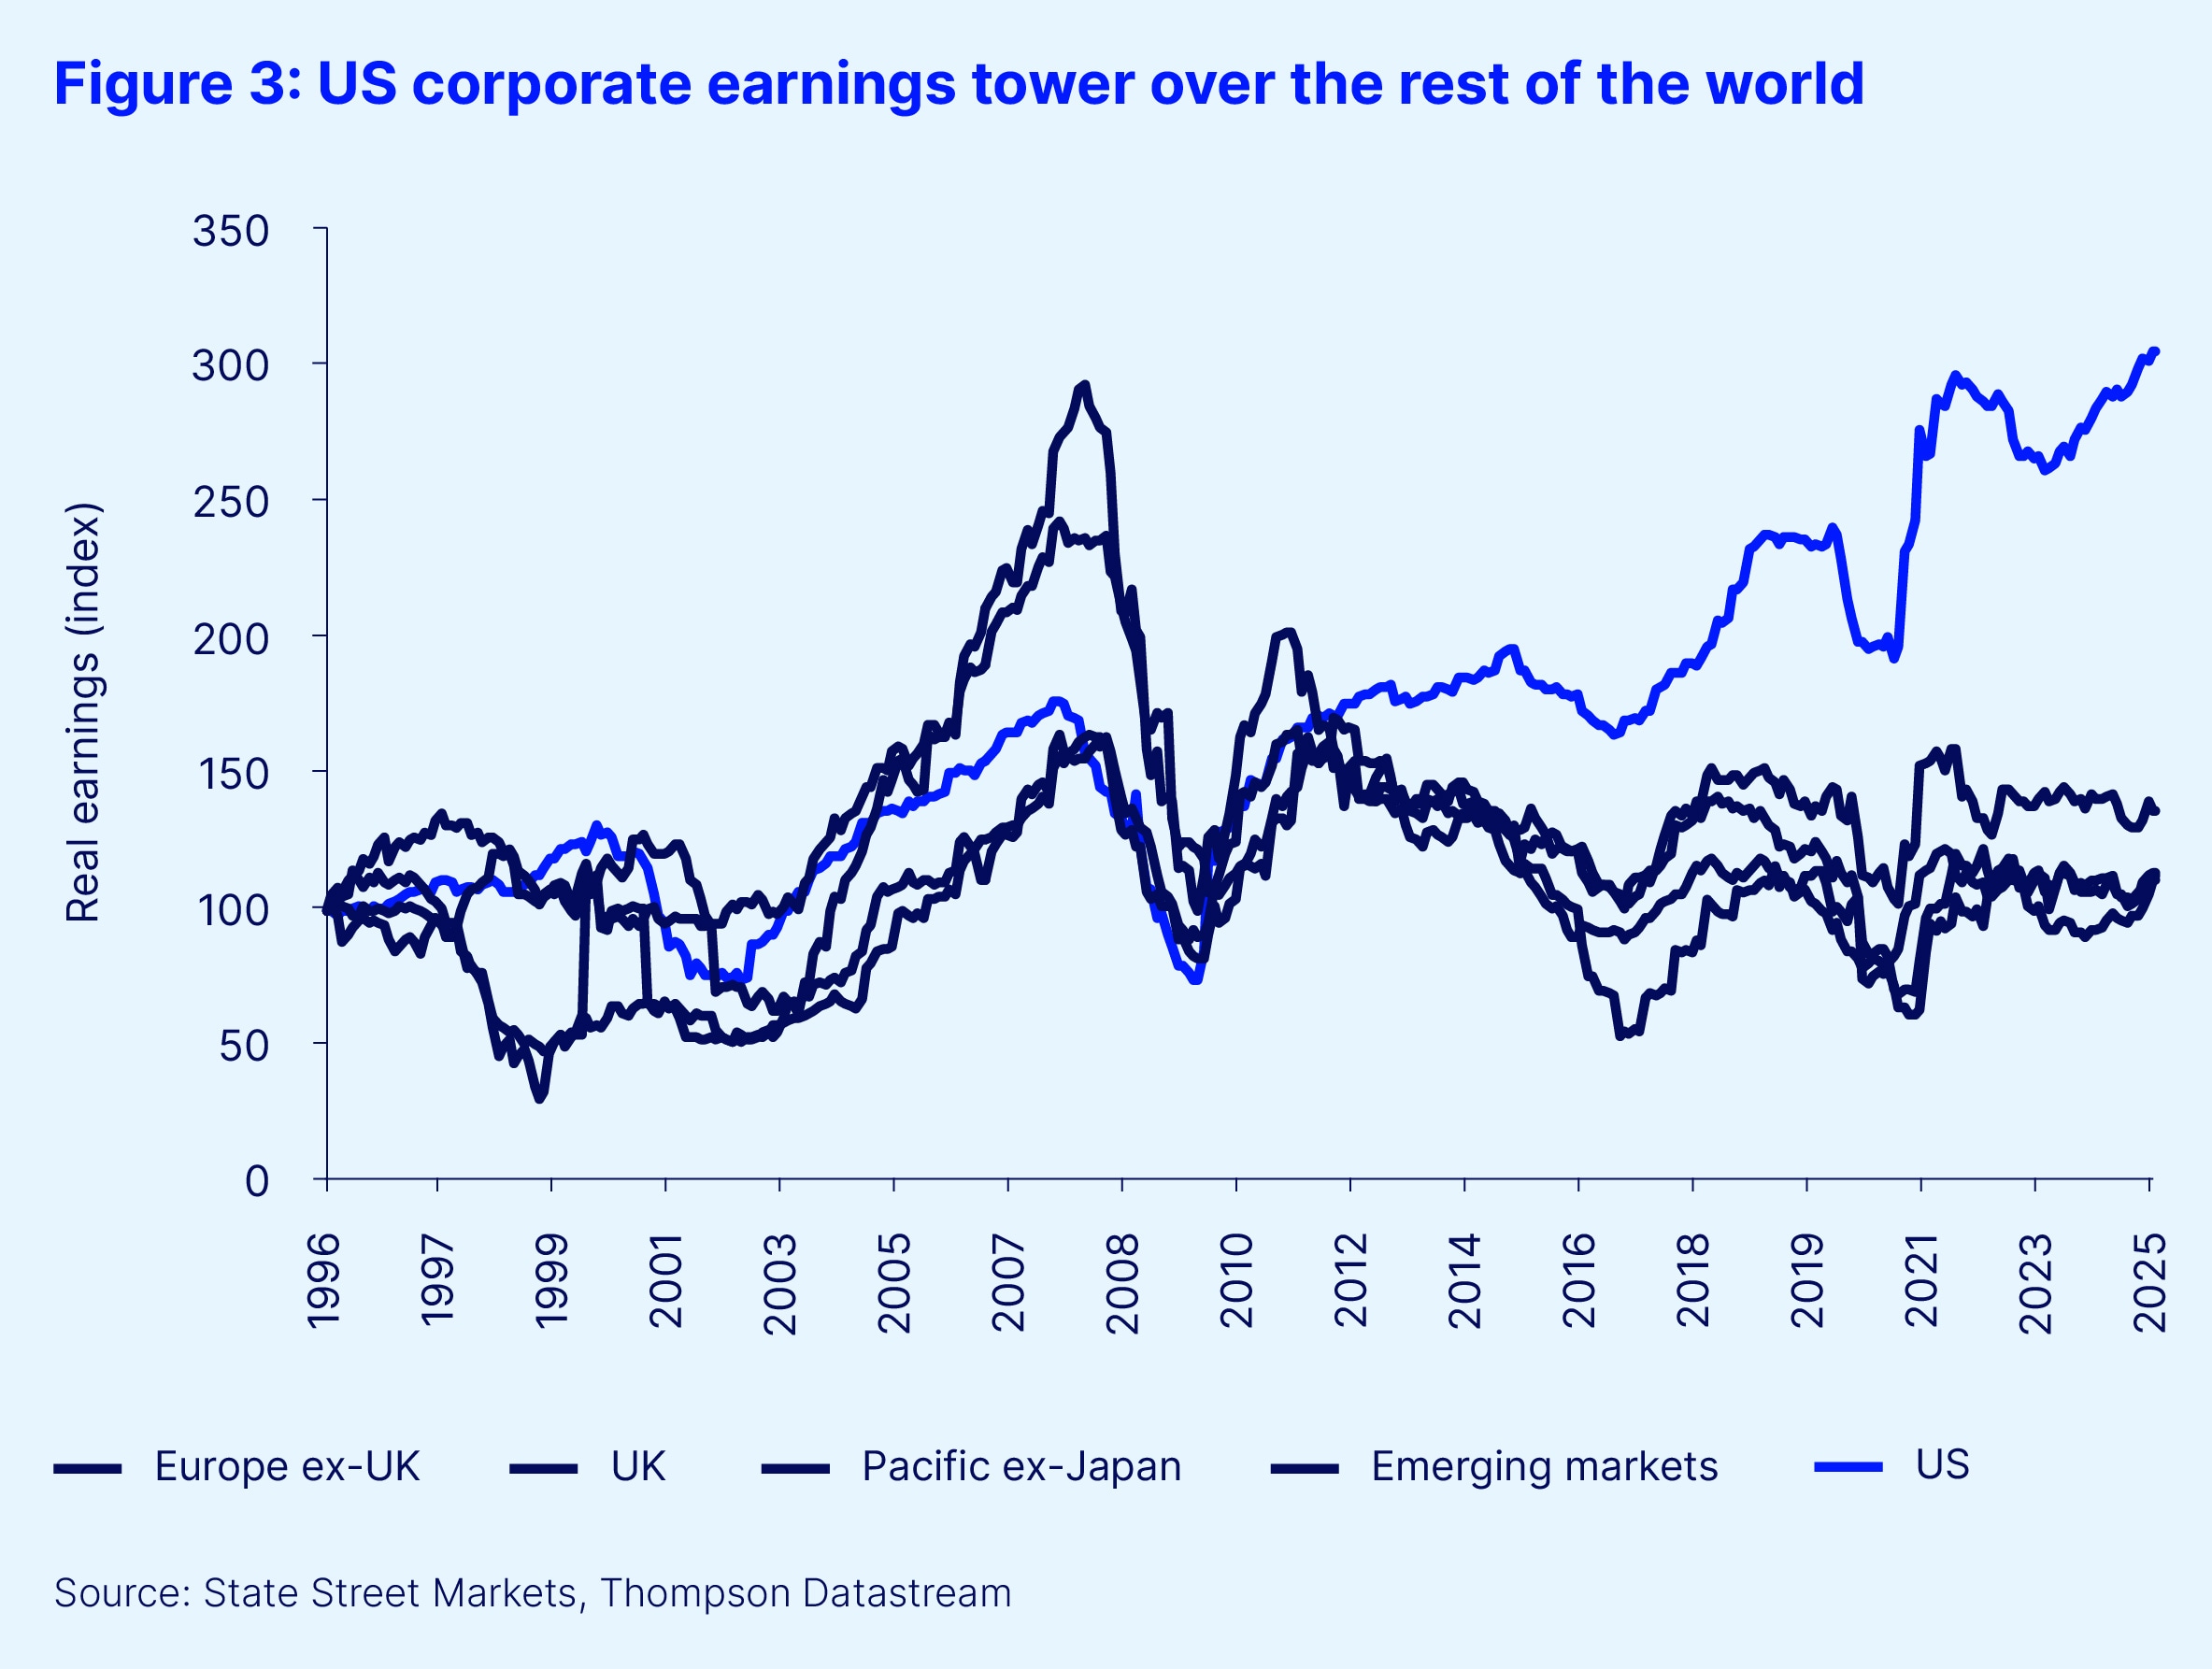
For years, United States stocks have been favored by global investors. This preference was based on a simple idea: In a world of sluggish economic and earnings growth, markets reward stocks with the best earnings, and the US has had the most profitable companies (see Figure 3). Hence, it is no surprise that US stocks have led equity markets for over a decade now. However, this outperformance has pushed valuation and positioning risks to high levels, indicating that earnings dominance is critical for US stocks to continue to outperform in 2026.
Consensus forecasts support continued US earnings dominance in 2026
Current analyst consensus expectations support the case for US stocks to continue to lead the rest of the world. Analysts expect US stocks to grow earnings by 13.5 percent in 2026, ahead of just 8.7 percent for Europe, Australasia and the Far East (EAFE). Recent earnings revisions in the US are also dominated by upgrades while the outlook for rest of the world is getting weaker.
However, caution is still required as the majority of earnings growth in the US is expected to come from a small group of large stocks — the “US Magnificent 7” (see Figure 4). Indeed, earnings growth in the US looks a lot less spectacular when we strip out these top seven technology companies, particularly against emerging markets (EM) (see our analysis of EM later in this outlook). Despite that, earnings expectations for US equities still outshine most regional rivals.
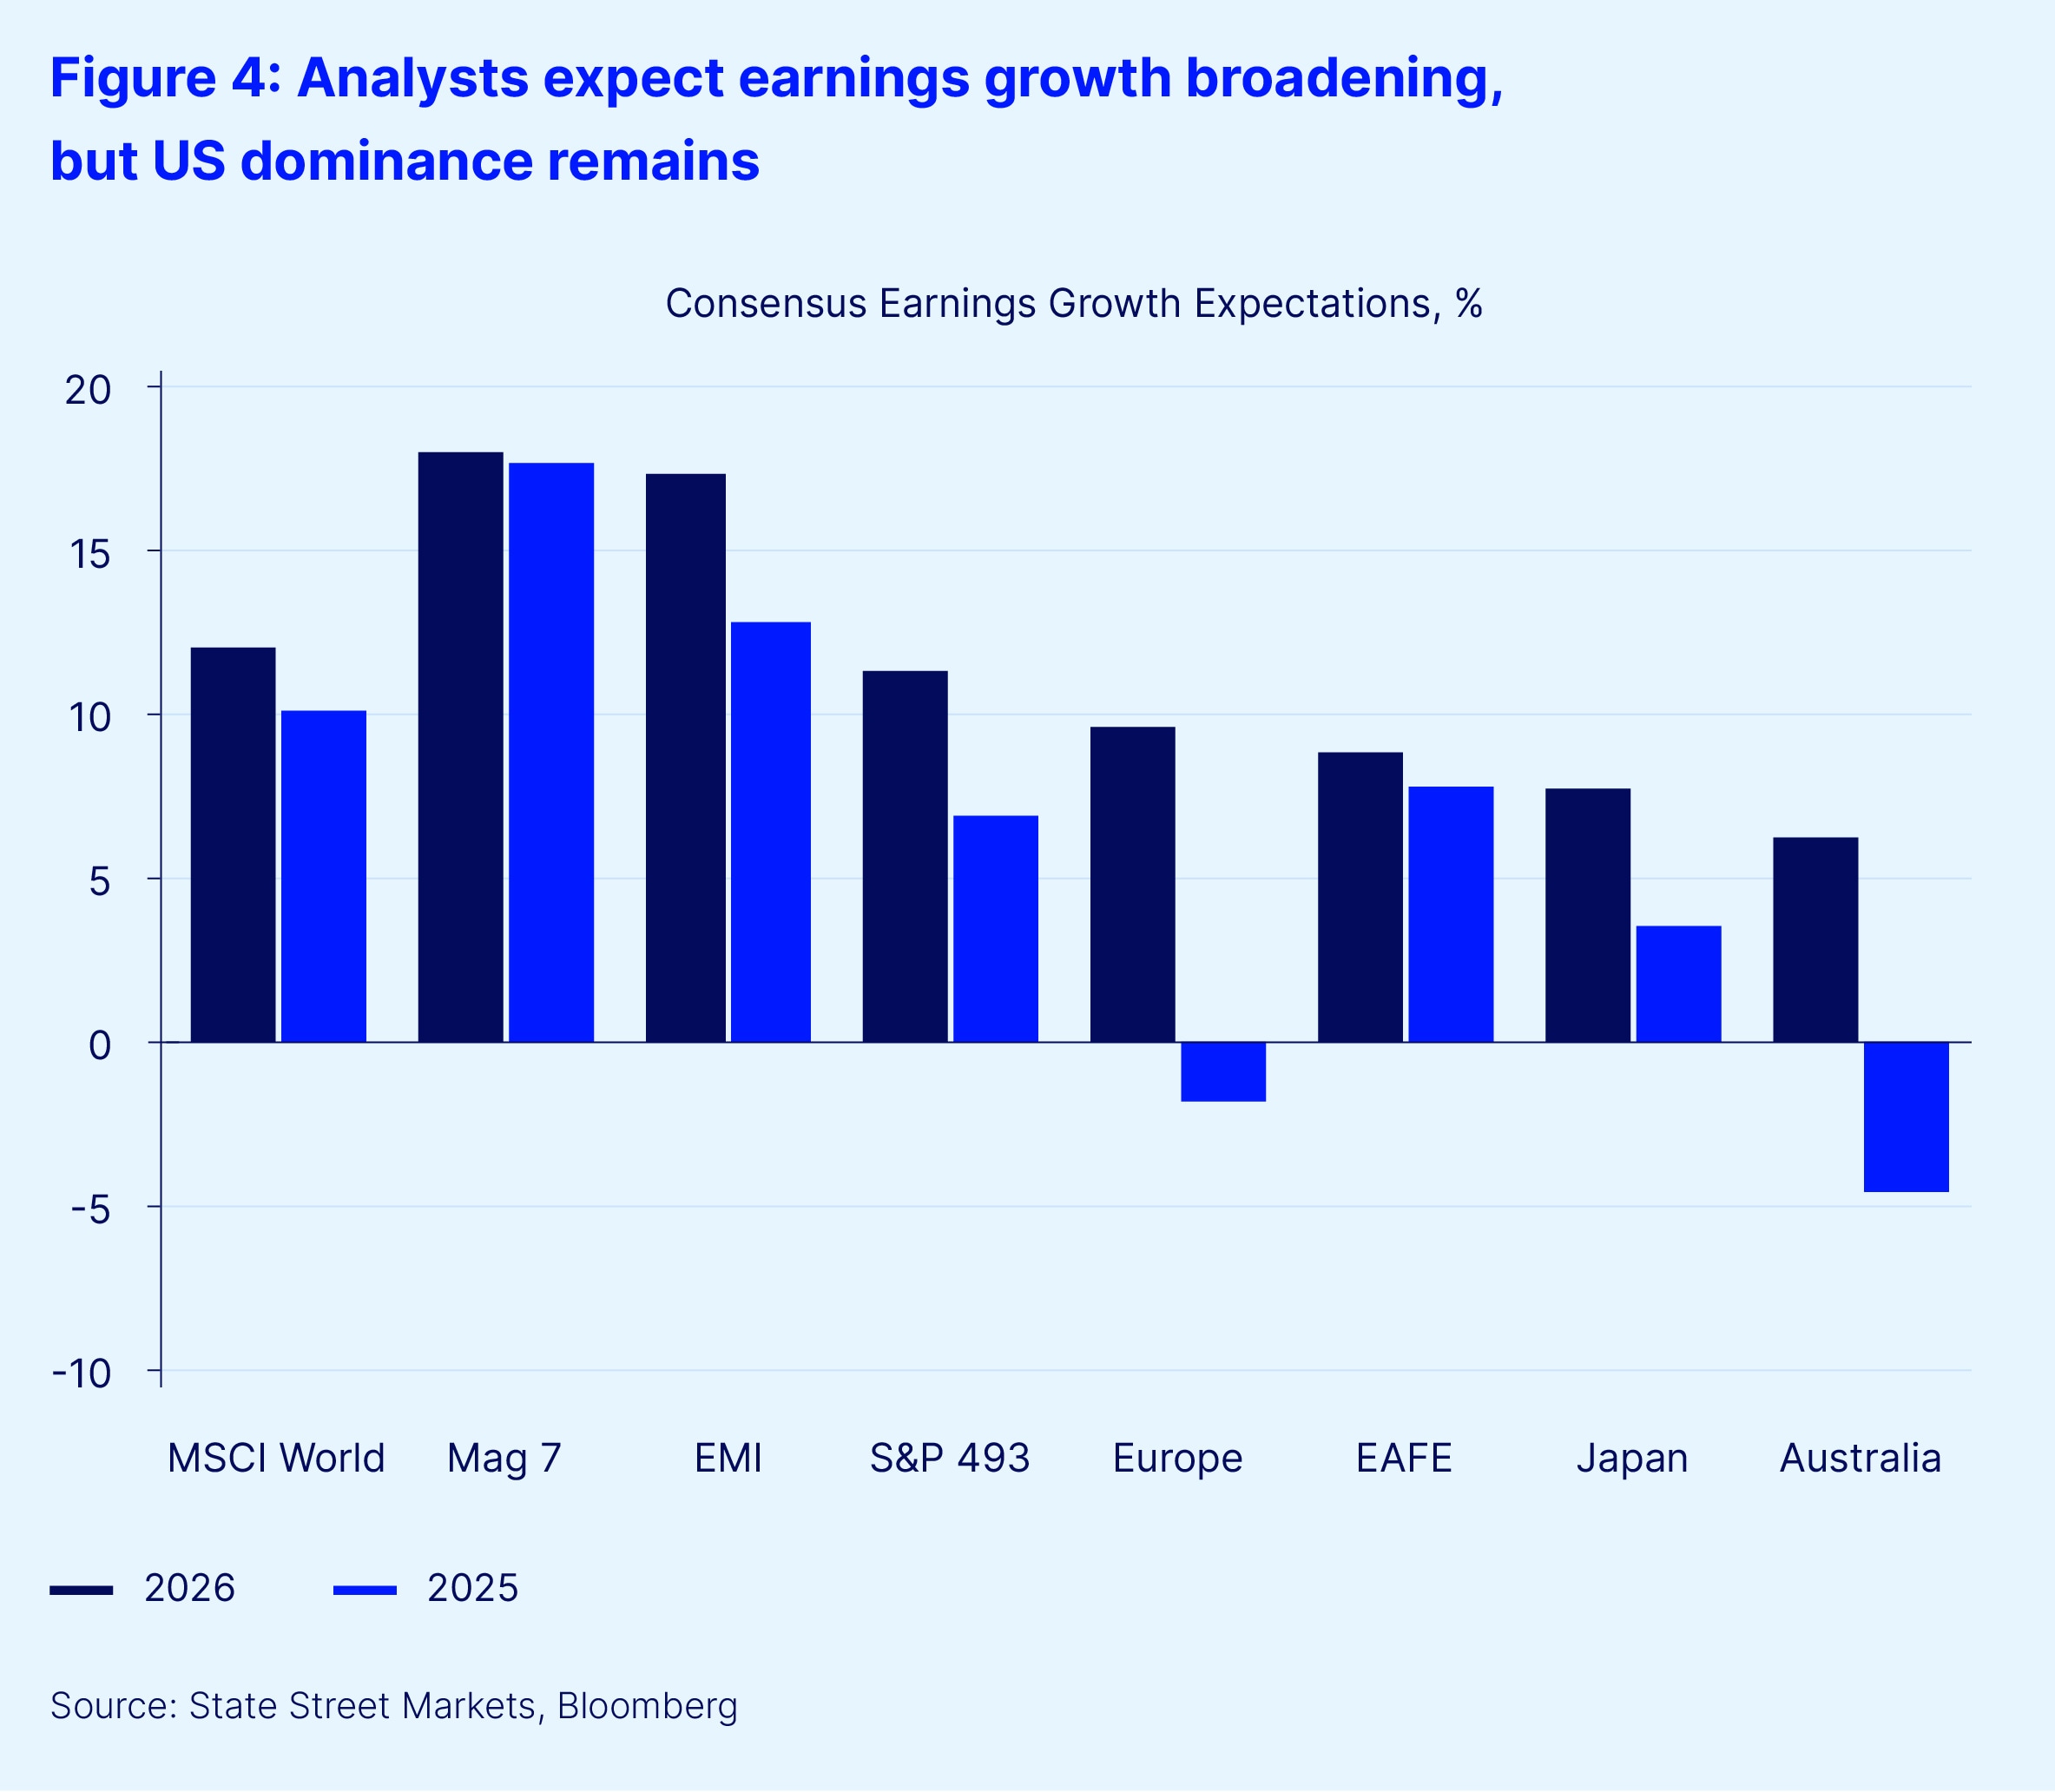
Another important insight for 2026 earnings is that analysts are yet again expecting earnings growth to broaden in other sectors in the US and other regions in the world, potentially catching up to the US Magnificent 7. These broadening earnings expectations have been a consistent theme in analyst forecasts since the 2022 post-COVID-19 recovery, yet they have failed to materialize.
Of course, past performance does not guarantee future returns and there is no reason for past earnings disappointments to carry into 2026, so we would recommend watching the trend in relative earnings growth closely. Historically, the best predictors of future earnings have been capital expenditure and operating leverage. For now, both of those drivers remain heavily skewed toward the US, and especially toward technology companies.
Institutional investors remain overweight in US equities despite brief interactions with other regions
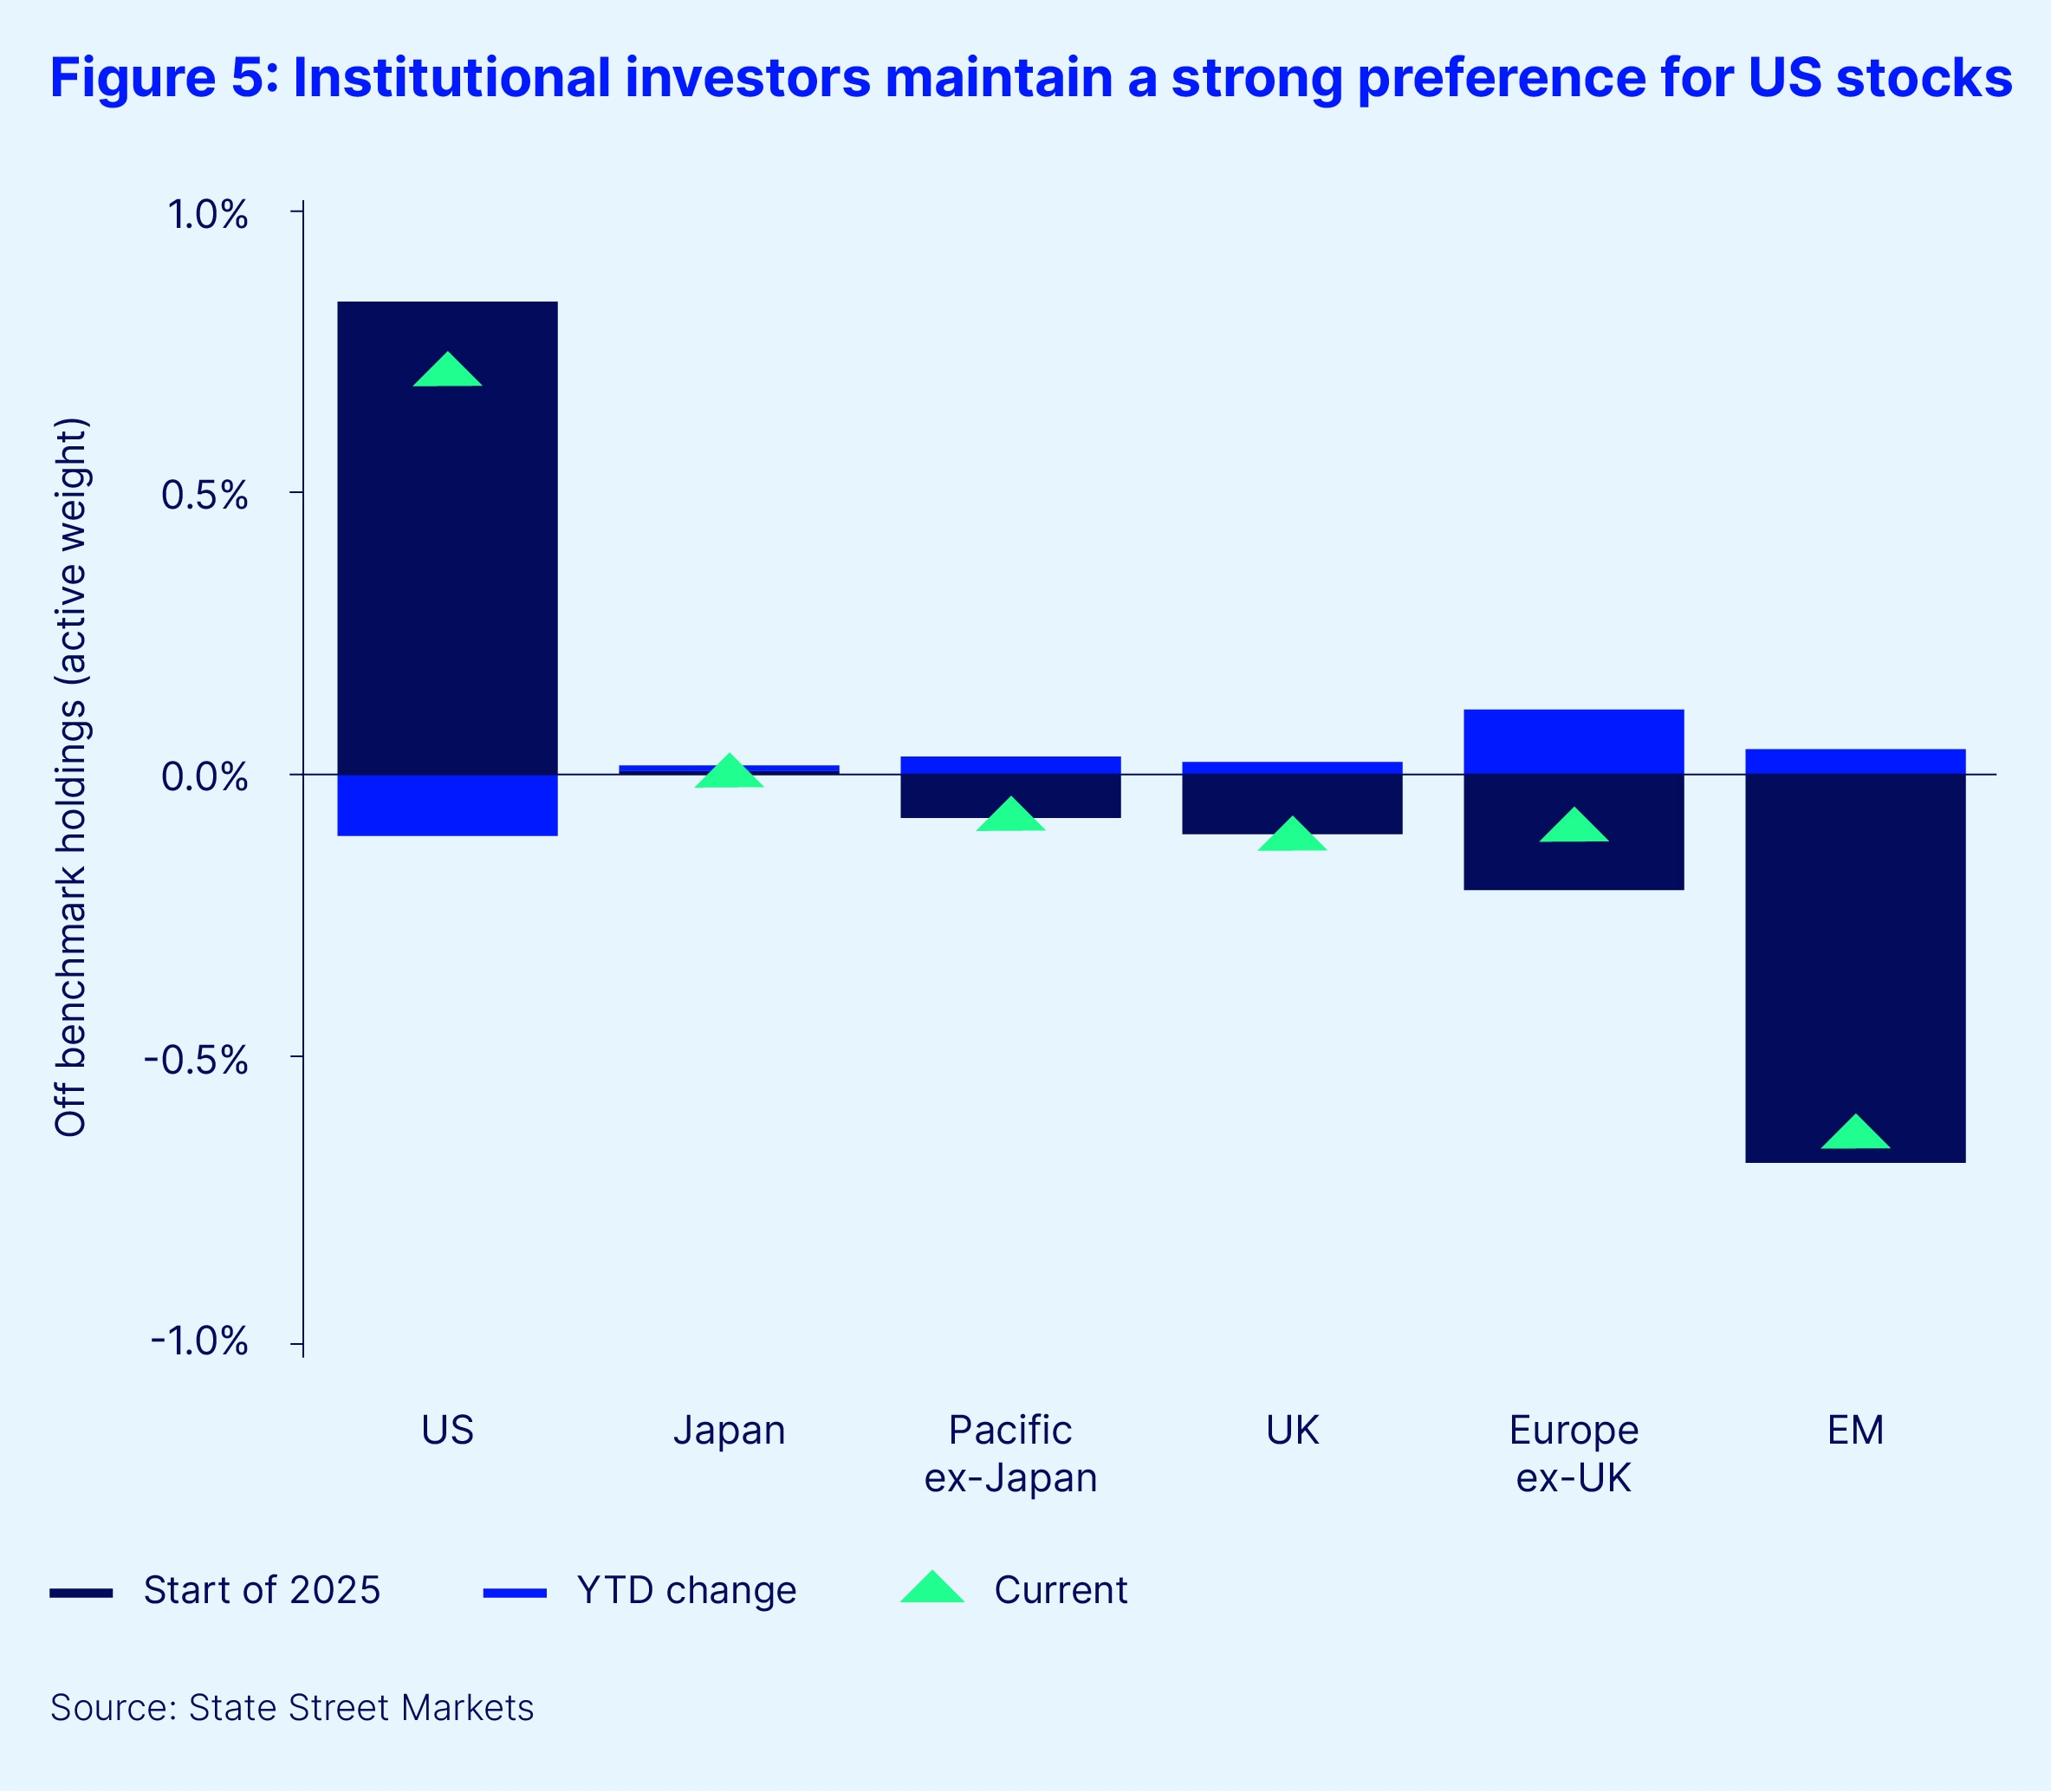
According to our Institutional Investor Indicators, investors are maintaining a healthy degree of skepticism about potential earnings growth outside the US. Our analysis of investor behavior trends in 2025, alongside developments in earnings expectations, may shed more light on investment plans in 2026 (see Figure 5).
At the start of the year, institutional investors questioned US exceptionalism as tariffs were seen as a supply shock (potentially raising prices and slowing economic growth) making it hard for the Federal Reserve to reignite the economy if needed. As a result, they shifted to some degree from the US to Europe, where the potential for a fiscal boost supported earnings growth expectations. However, a European earnings recovery has failed to materialize (currently EPS growth is expected to end the year at -2 percent) and institutional investors abandoned European stocks.
Later in the year, investors were encouraged by the Chinese authorities’ efforts to boost domestic demand and they reduced their underweight positions there. Yet once again, earnings growth failed to materialize (currently also tracking at -2 percent year-on-year) and institutional investors increasingly lost interest. Instead, we now see investor appetite for Latin America and tech-heavy Asian stock markets increasing, where earnings expectations remain solid.
Finally, recent elections in Japan have rekindled investor interest there with the hopes that a more expansionary Japanese fiscal policy and new structural reforms could boost earnings growth. Yet here too, worries that inflation may strengthen the Japanese yen seem to be dampening recent enthusiasm.
After having ventured into different markets this year, institutional investors have shown a preference for continuing to invest in what they perceive as reliable earnings growth in the US. In fact, we have seen nearly six months of uninterrupted buying of US equities from institutional investors.
In conclusion, we believe that the key factor to watch for with regard to regional equity allocation is relative earnings growth. For years, the profitability of US companies has towered over the rest of the world, which was rewarded by multi-year outperformance. Analysts, as is customary for their year-ahead analysis, are looking for earnings growth to broaden regionally. However, institutional investors, and we here at State Street Markets, are yet to be convinced.
What AI and alternative data reveal about interest rate markets in 2026
Michael Guidi, head of Alternative Data, State Street Associates
Michael Metcalfe, head of Macro Strategy, State Street Markets
In 2025, financial markets were shaped not just by the anticipation of AI-driven returns, but also by shifting expectations around central bank interest rate policy. These expectations led to significant moves in both short- and long-term interest rates, with ripple effects across asset classes. As we enter 2026, a key question is: What can AI and alternative data — especially tools like State Street PriceStats — reveal about the likely divergence in interest rate markets? And even more critically, how might these insights help us anticipate the next move in short- and long-term rates?
The power of language analytics to determine central bank tone
Central banks are prolific communicators, aiming to guide market expectations and smooth the impact of their policy decisions. The financial media amplifies these messages, often highlighting the most market-relevant statements. Large language models (LLMs) now enable us to systematically analyze this vast communication flow. In partnership with fintech company MKT MediaStats, we can classify central bank statements and media coverage as “hawkish” (favoring tighter policy) or “dovish” (favoring easier policy), and construct real-time indicators of monetary policy sentiment. In our experience, we have found that these AI-driven tone measures are valuable tools for forecasting policy shifts.
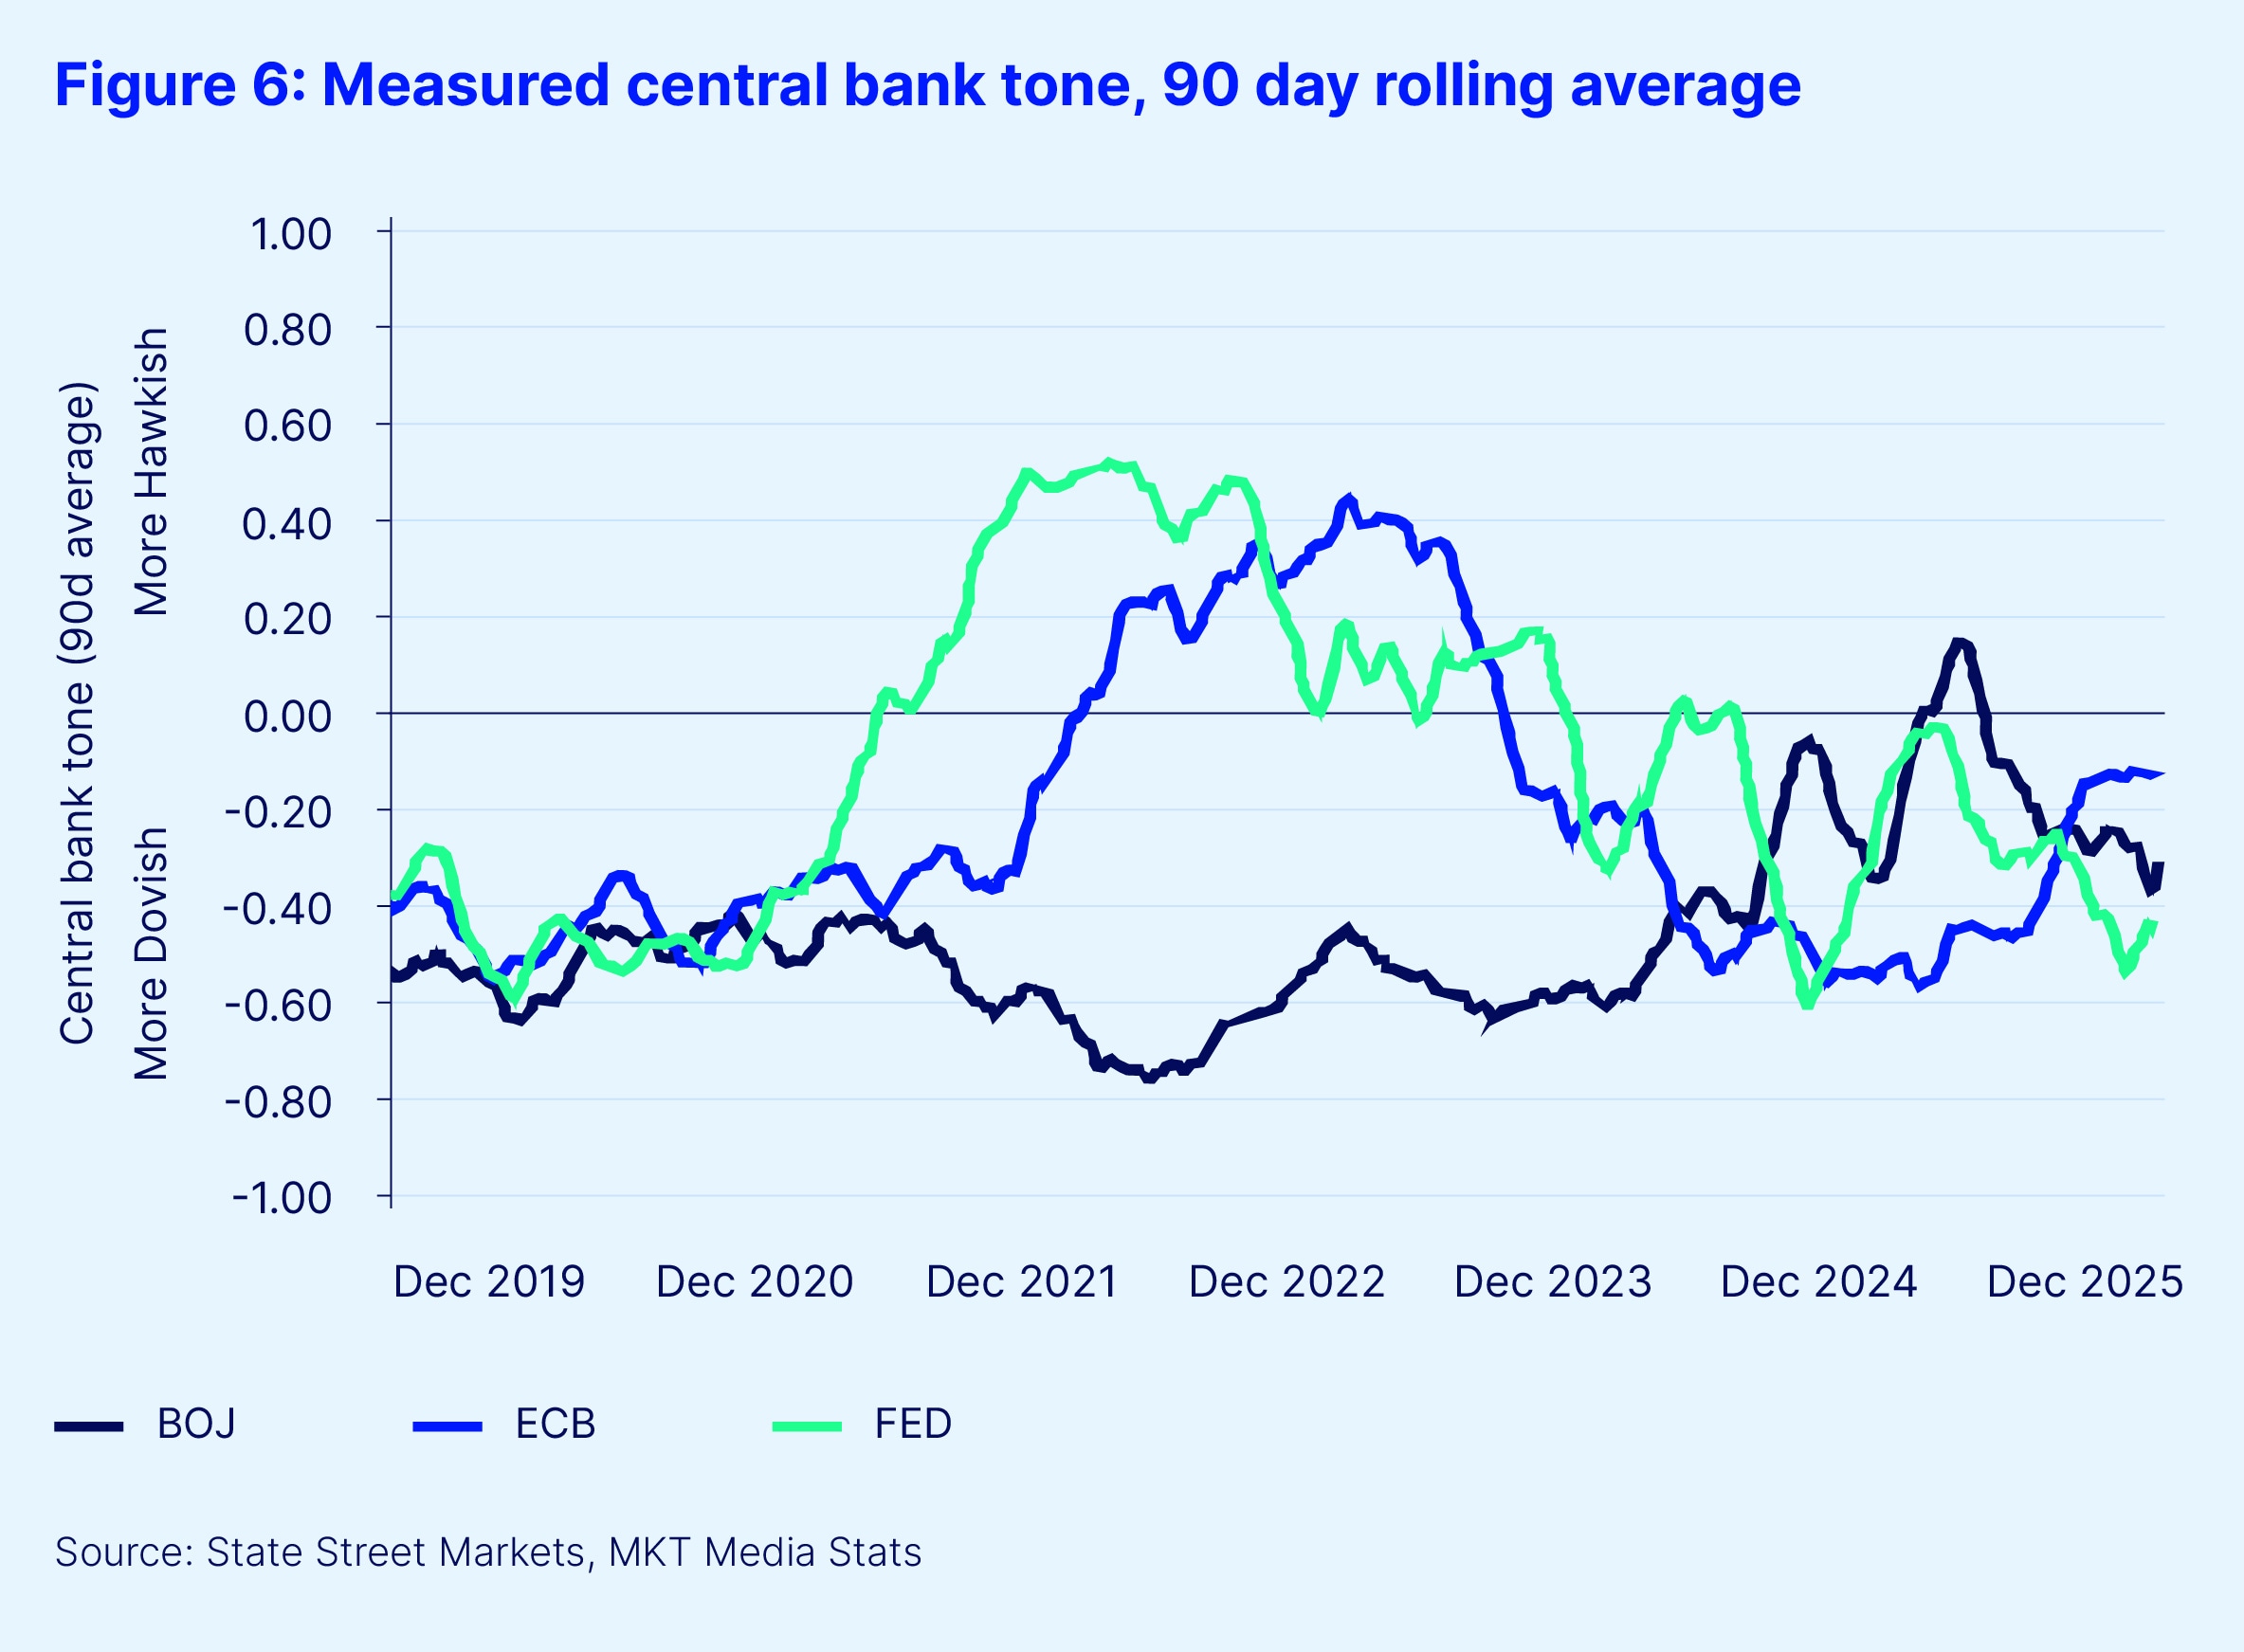
At the start of 2025, the European Central Bank (ECB) was the most dovish among the major central banks, but after its final rate cut in June, its tone shifted and it is now the least dovish of the G3 (see Figure 6). Meanwhile, the Bank of Japan (BoJ) and the Federal Reserve have shown more variation in their tone. The BoJ, after years of ultra-accommodative policy, is now only slightly more dovish than the ECB, reflecting tentative normalization and a desire to avoid further yen weakness.
The Fed, by contrast, became markedly more dovish from June onwards and has since delivered rate cuts at the last three meetings of 2025. But we would be cautious about extrapolating from that. Our AI-based tone analysis also quantifies the degree of disagreement among individual central bankers, revealing the highest levels of internal divergence in over four years at the Fed. This suggests a heightened risk of policy surprises and market volatility, and implies that the Fed will continue to stress a “data-dependent” approach.
Real-time insights from alternative inflation data
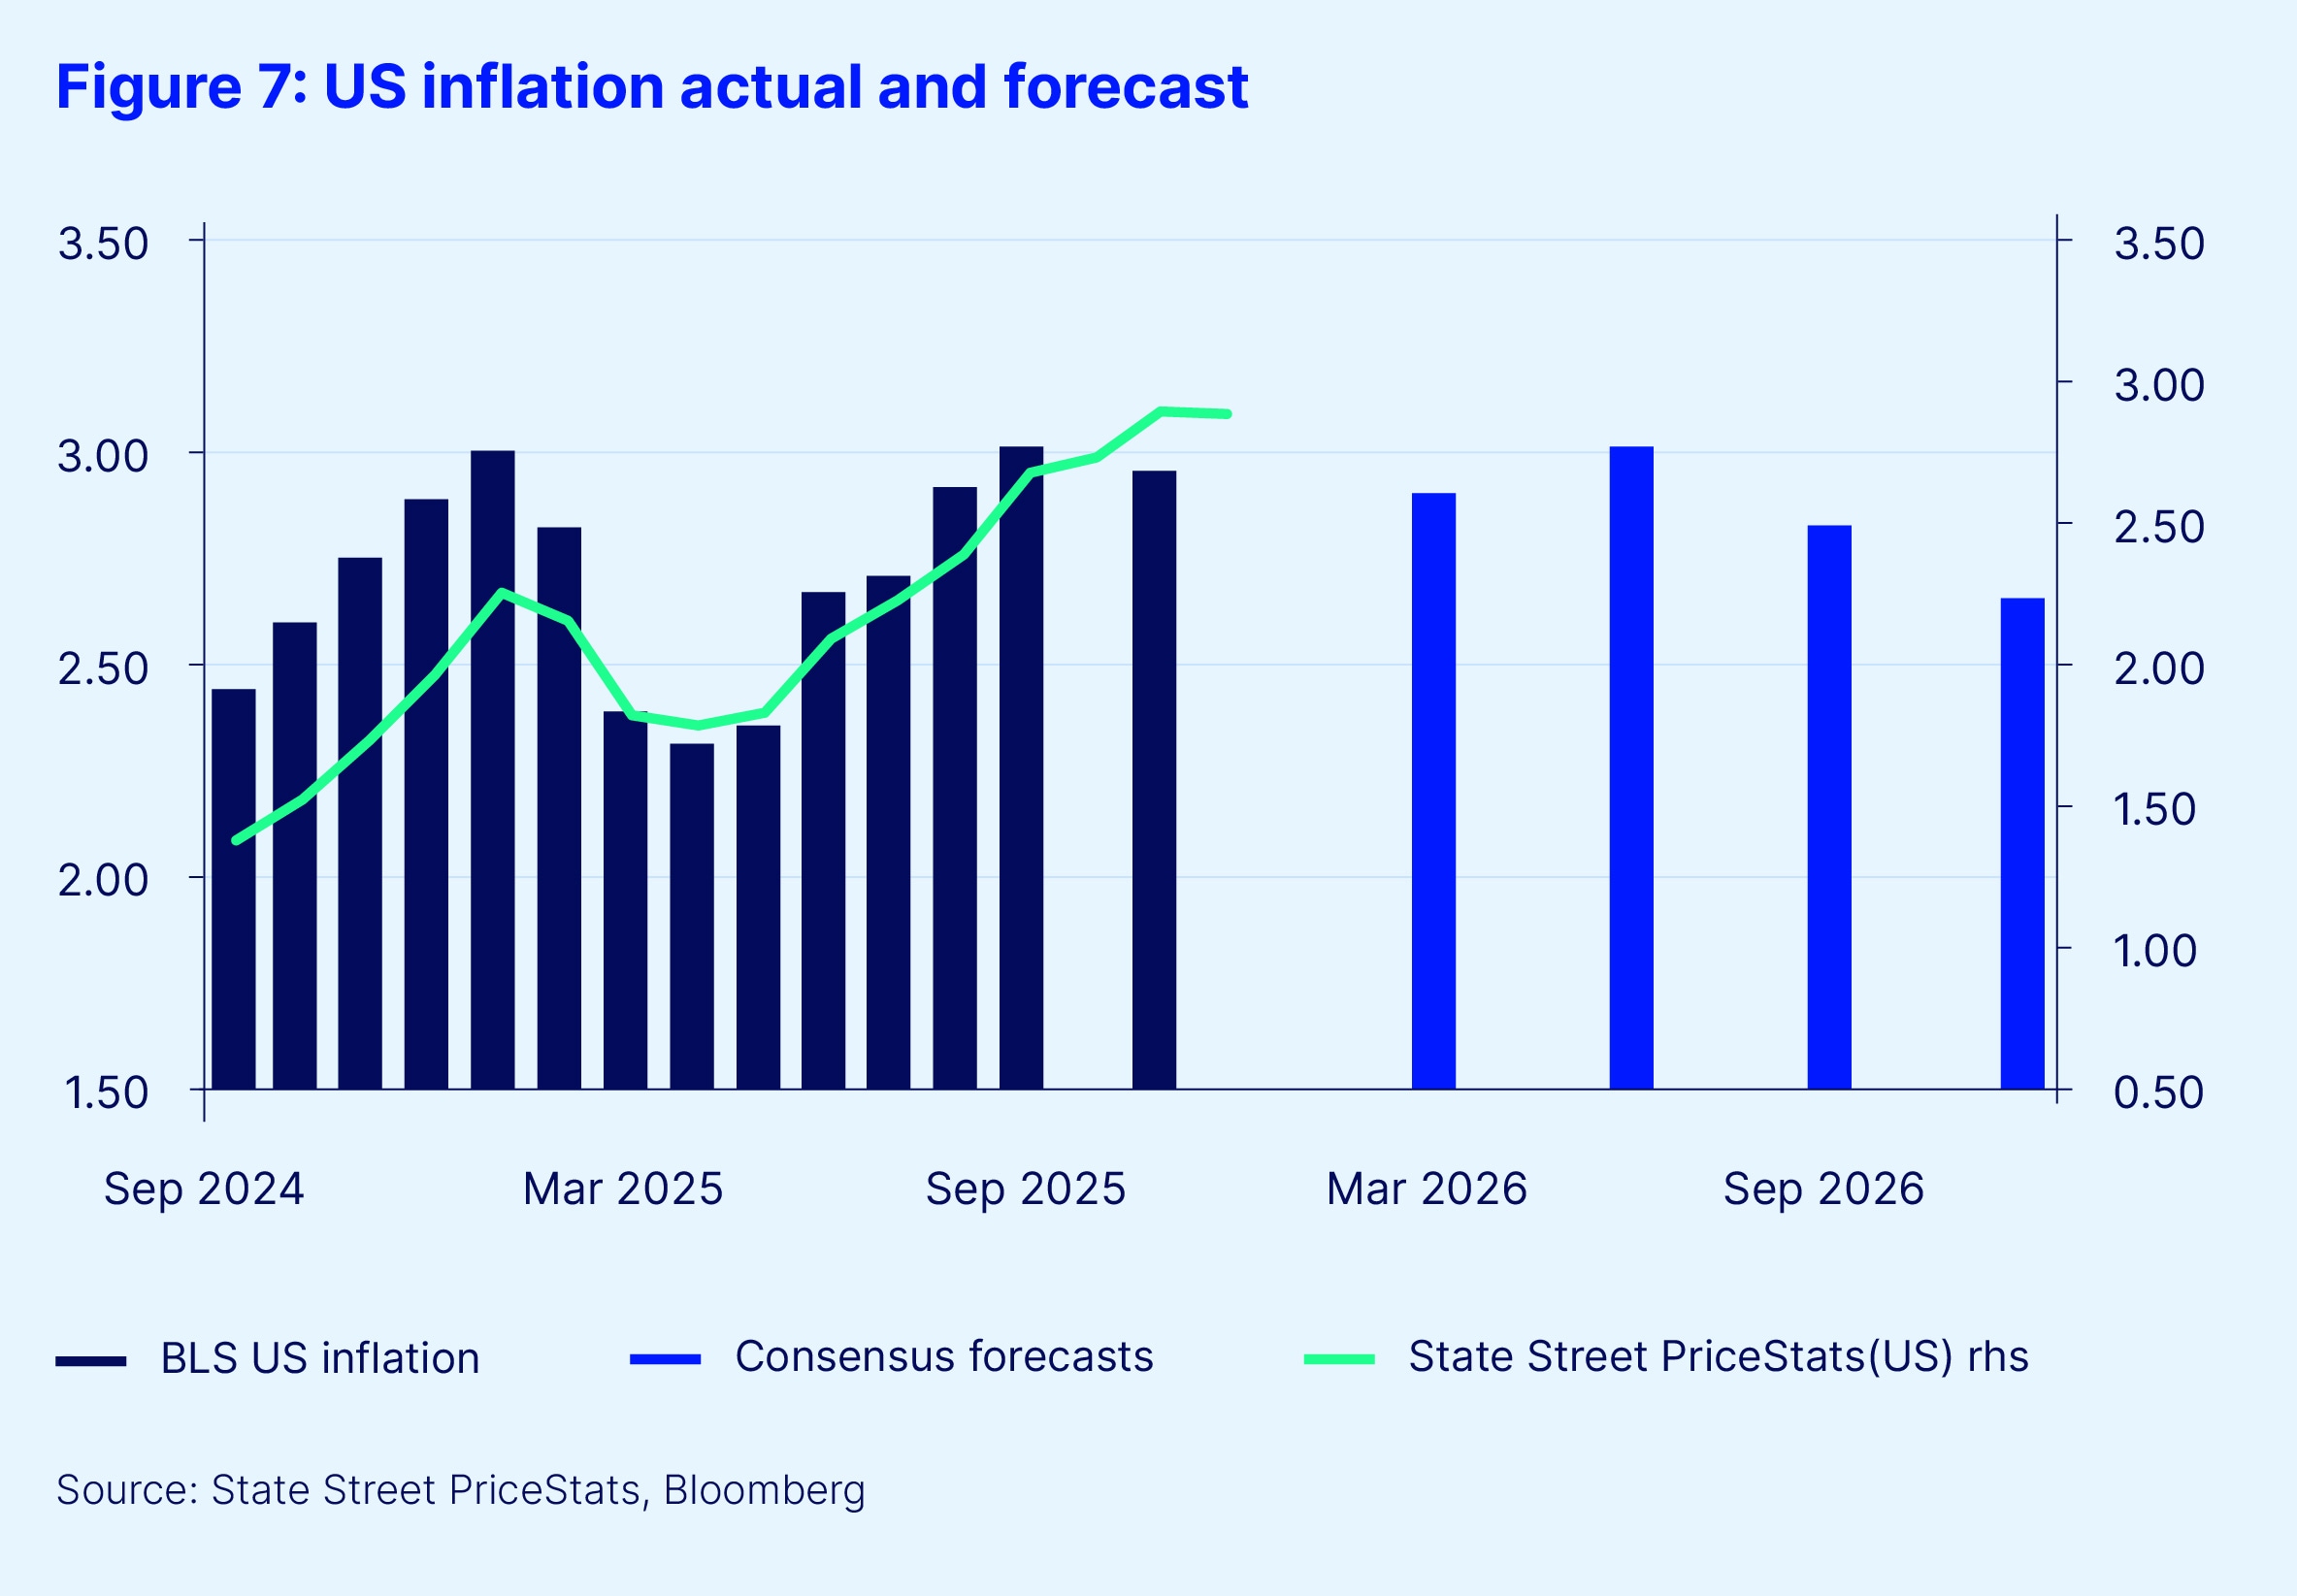
The debate within the Fed’s chief policy-making body – the Federal Open Market Committee (FOMC) – will ultimately be shaped by the path of inflation. Despite volatility, US inflation ended 2025 close to mid-year forecasts. State Street PriceStats, a high-frequency inflation tracker, has proven especially useful — capturing downside surprises in official data in early 2025 and the summer’s inflation reacceleration, and even substituting for official data during the fourth quarter US government shutdown.
As 2026 begins, State Street PriceStats shows US annual inflation, particularly in goods, plateauing and starting to roll over in line with forecasts (see Figure 7). If the labor market continues to soften, this should reduce Fed disagreements and pave the way for further Fed easing, moving rates back toward neutral as the consensus expects.
What is perhaps an even more revealing finding from State Street PriceStats is the recent re-acceleration of inflation in Europe, and deceleration in Japan (albeit from an elevated level). This divergence mirrors the shifts in central bank tone and points to a more fragmented global economic outlook. For Europe, it suggests the next rate move could be upward, in line with the ECB’s more balanced tone. For Japan, again following the tone, it signals that any tightening cycle will likely be cautious and shallow.
A divergence in demand will drive bond markets in 2026
The BoJ’s caution is rooted in nearly two decades of disinflation and a desire to avoid disruptions in long-term yields. Across asset classes, the message is again one of divergence. Throughout 2025, asset manager demand for 30-year US Treasuries was below average for all but one month. Conversely, demand for Eurozone and Japanese sovereign debt from international investors was above average.
In the second half of 2025, more constructive price action in the US Treasury market suggests that other investor segments have stepped in to fill the gap. However, few sources of demand are as stable as long-term asset managers. If these buyers do not return in 2026 and the Fed continues to cut short-term rates, the risk of greater volatility in yield and yield curve steepness looks to be higher in the US than elsewhere.
Overall in 2026, we expect an unusual divergence in G3 policy rates and continued risks at the long-end of the US curve.
Dollar bounce or more of the same?
Lee Ferridge, head of Multi-Asset Strategy for the Americas, State Street Markets
2025 was a tough year for the US dollar (USD). The US Dollar Index (DXY) has fallen by 9.4 percent so far this year; its worst annual performance since 2016 and the second worst since 2003. You might expect that what goes down must come up — but is that always true?
One of the most notable takeaways from our US Dollar Investor Behavior Indicators is that, despite the USD’s poor performance in 2025, overseas owners of US financial assets did not materially increase their USD hedge ratios this year (see Figure 8). That means they maintained their exposure to the USD in the face of its decline.
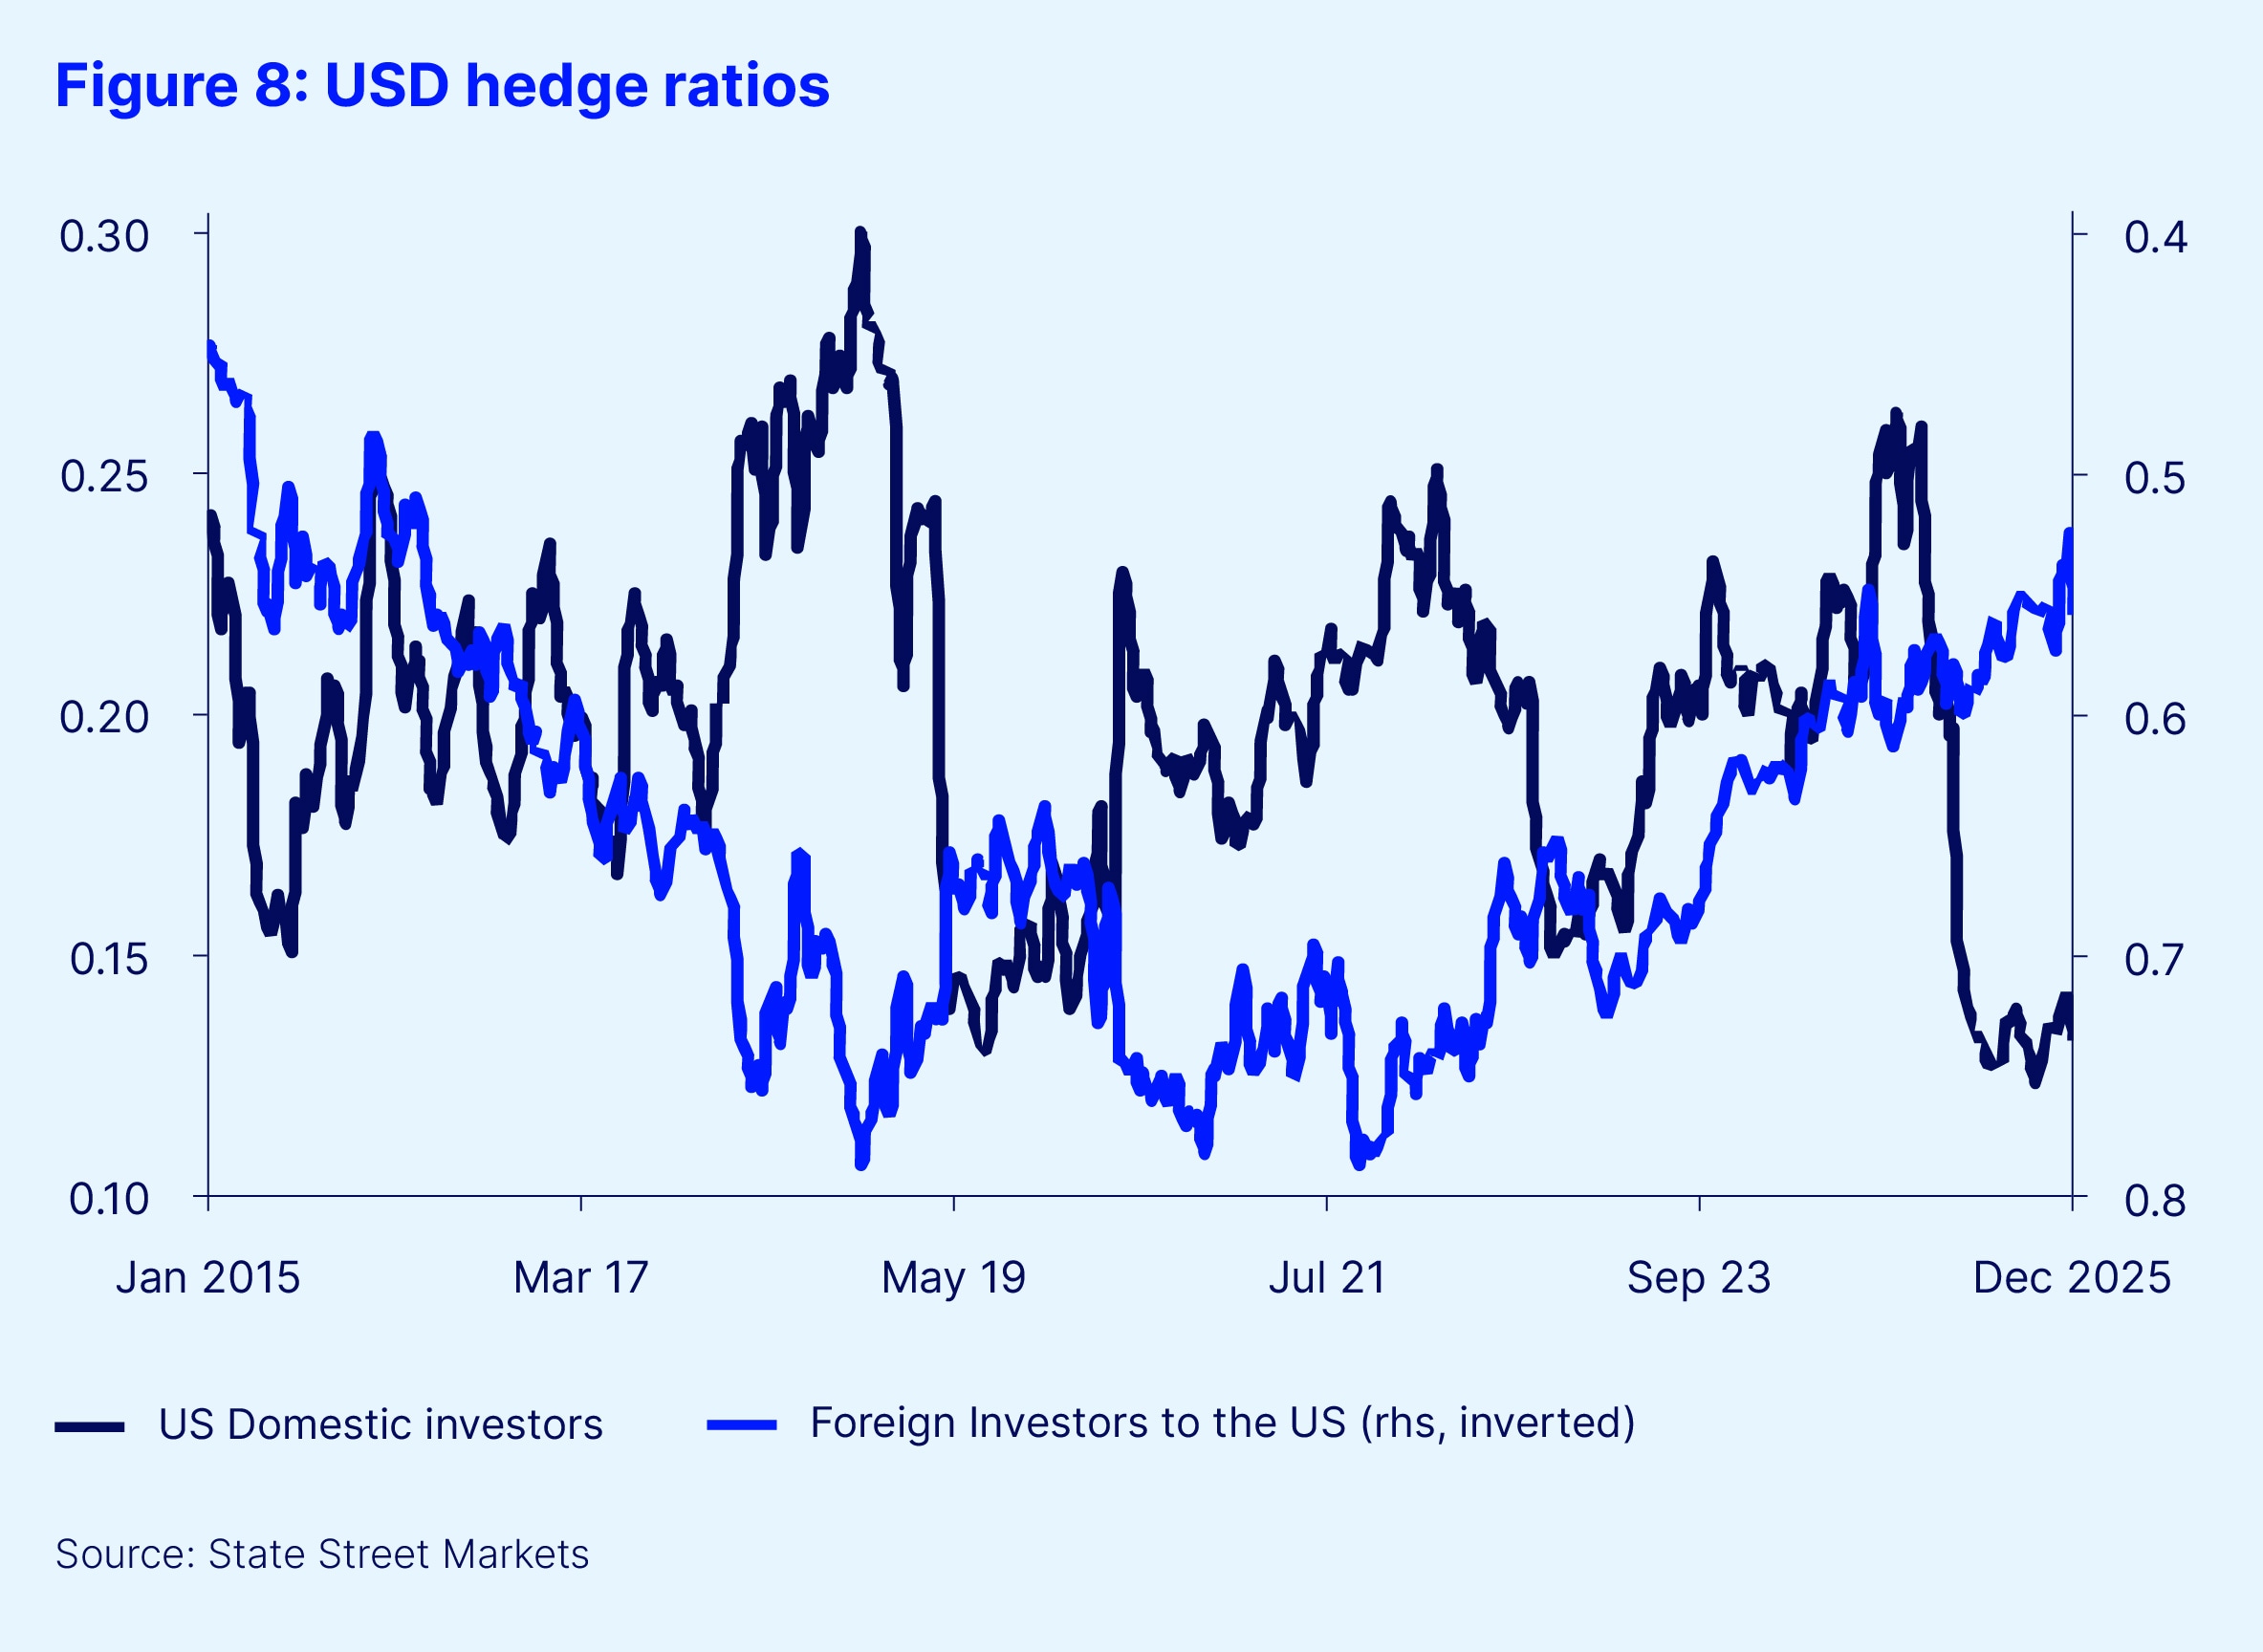
As Figure 8 illustrates, rather than overseas investors increasing their USD hedge ratios in 2025, they have actually reduced them slightly, from close to 58 percent at the start of the year, to 56 percent now. At its nadir in 2025, the overseas USD hedge ratio fell to just under 53 percent; its lowest level since 2016.
When it comes to FX hedging activity, it was US domestic investors who had the most pronounced reaction in the lead-up to, and immediately following, the “Liberation Day” market volatility. US investors more than halved the hedge ratio on their foreign currency exposures (i.e., they sold USD) from around 25 percent at the start of 2025, to a low of a little above 12 percent. The current reading is just over 13 percent. In large part, US investors were behind the dramatic sell-off in the USD seen in the first half of this year.
The next question to consider then is: Given the USD’s poor performance, why did foreign investors hold firm? Why didn’t they increase their USD hedge ratios, thereby reducing their exposure to a declining USD?
The answer is captured in Figure 9. As our chart illustrates, the decision over how much to hedge USD exposure is heavily influenced by the cost of the hedge. In early 2022, before the FOMC started its post-COVID-19 hiking cycle, it was effectively free for overseas investors to hedge their USD risk. At that time, our USD Foreign Hedge Ratio Indicator was at 78 percent. Since then, it has steadily declined due to rising hedging costs for overseas investors converting to USD. Although the US interest rate premium over a DXY-weighted G10 index has narrowed in recent weeks, foreign investors will still, on average, be giving up around 1.5 percent of their returns to hedge the USD.
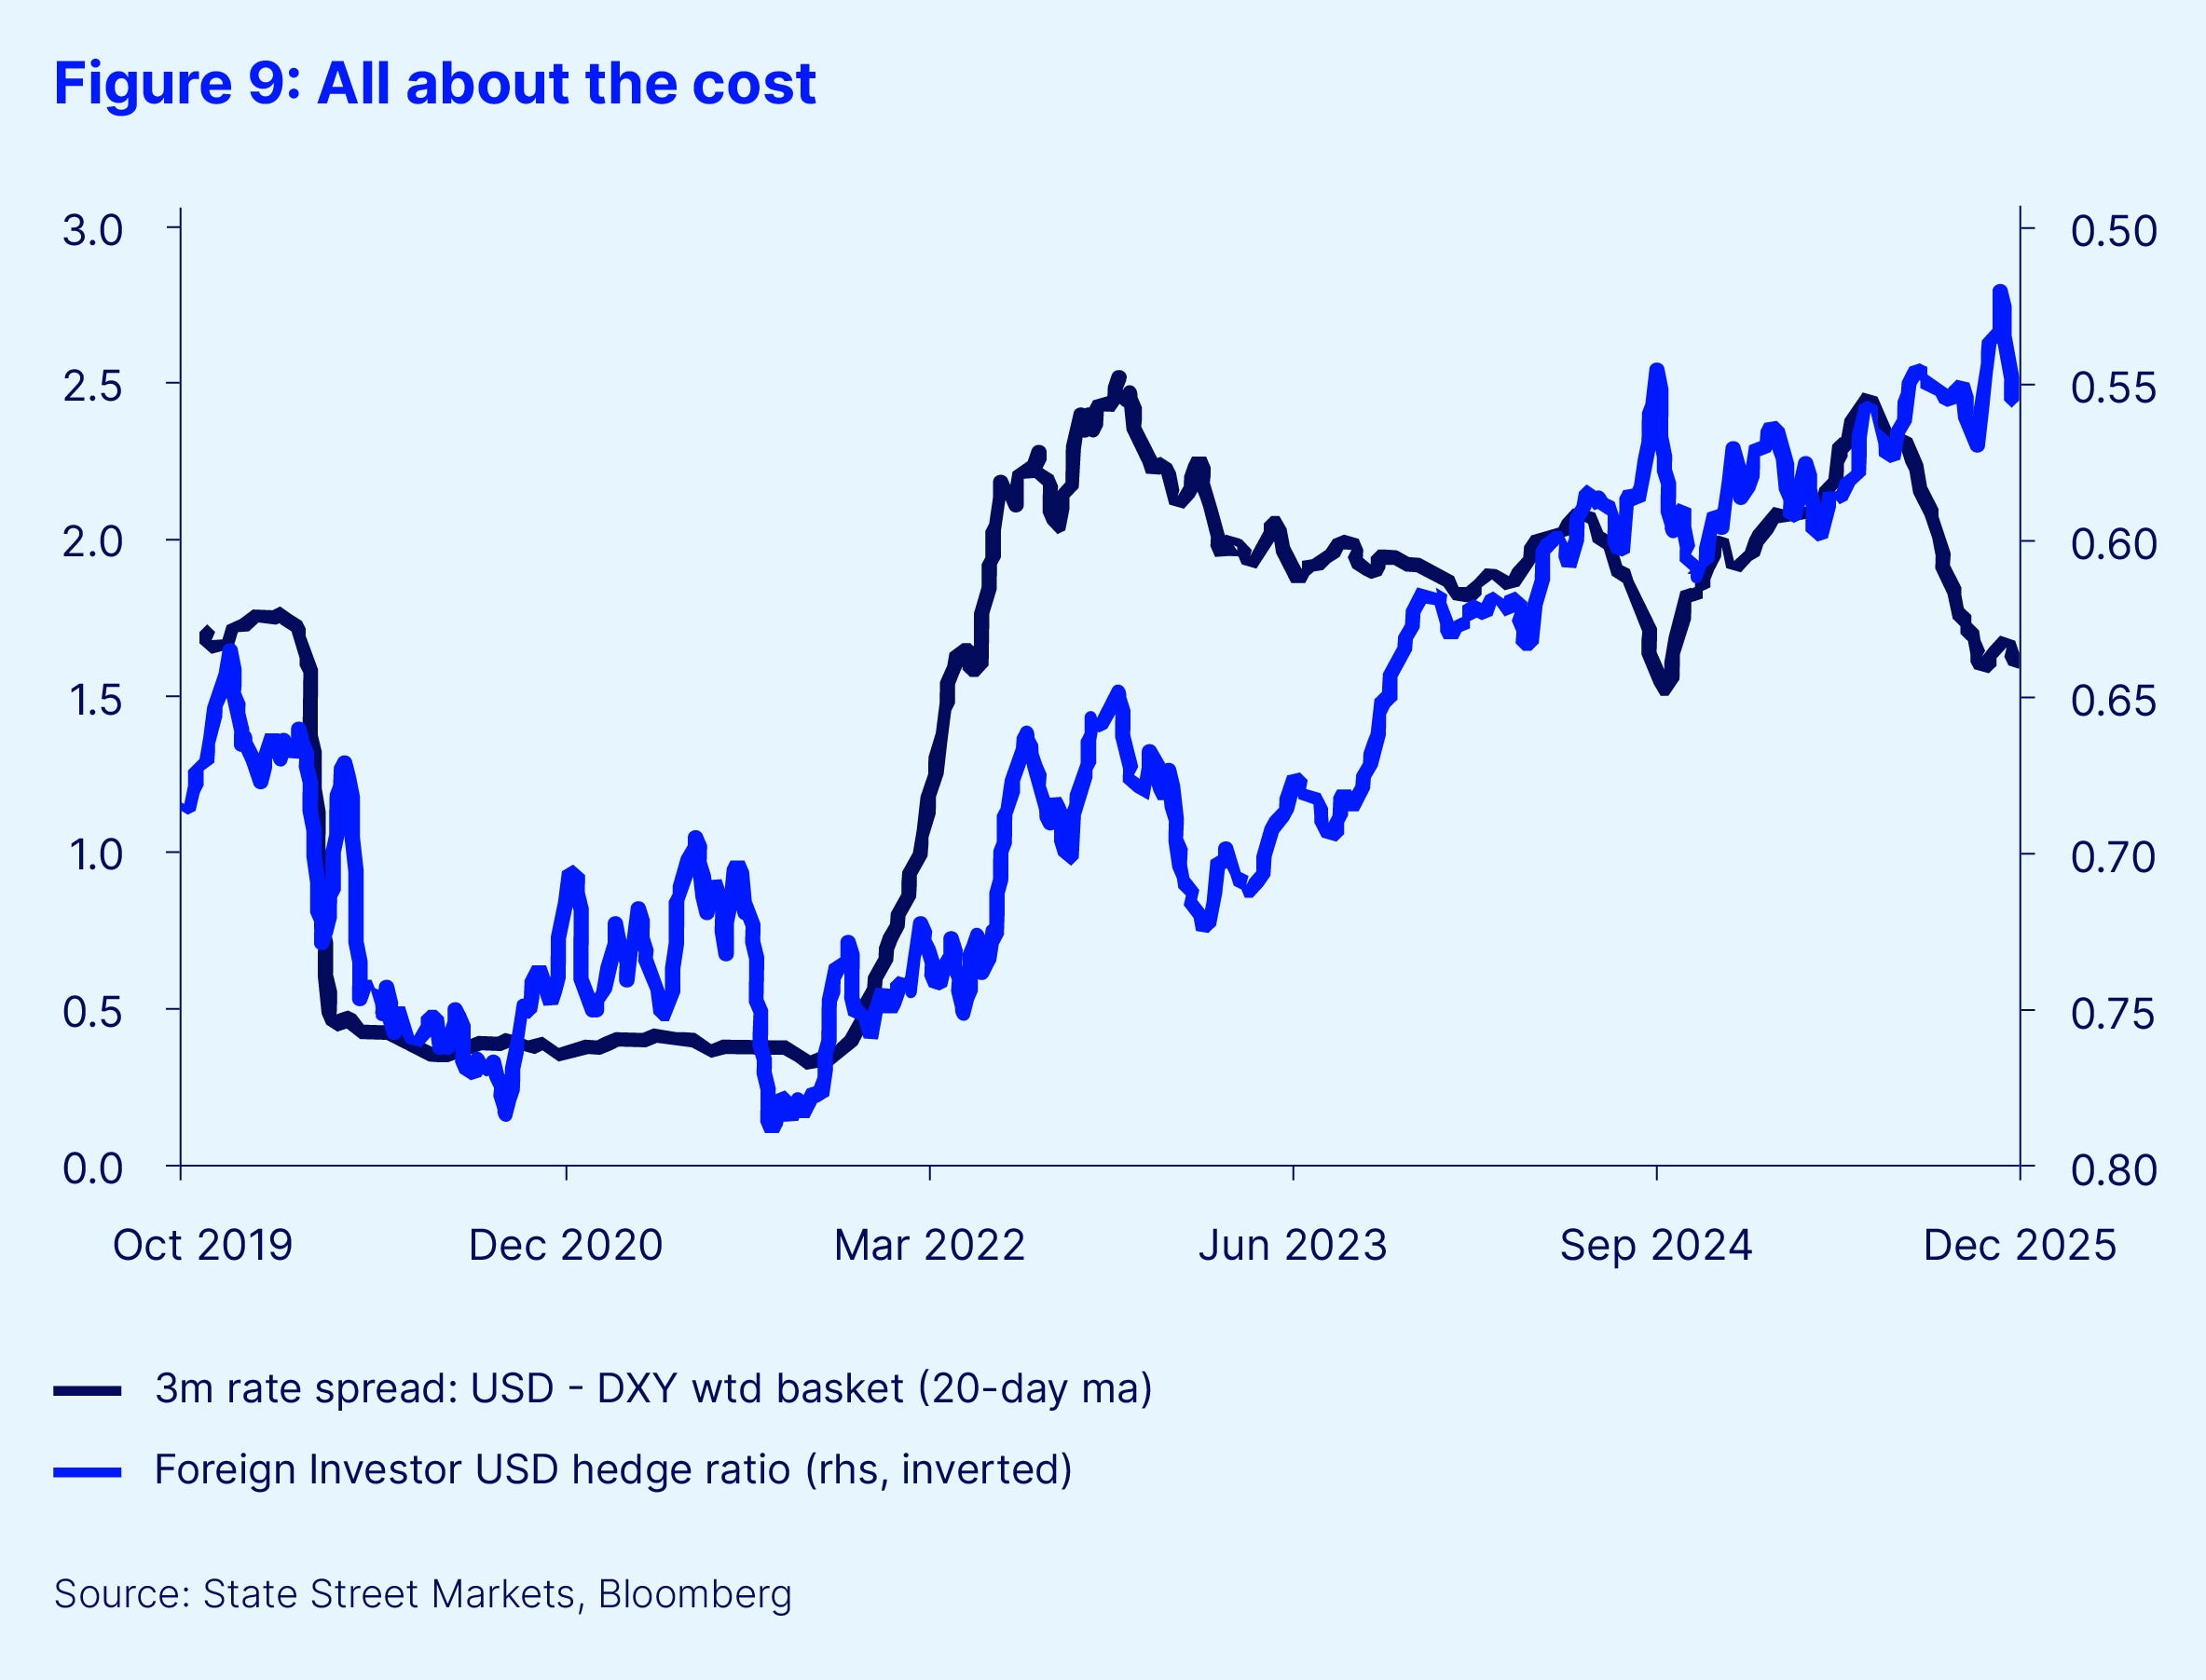
However, when we look ahead to 2026, consensus expectations suggest that this hedging cost will fall meaningfully over the coming quarters. The FOMC is currently priced to cut a further two times in 2026. While not particularly significant, it stands in sharp contrast to the interest rate expectations across much of the G10, as highlighted earlier in this 2026 outlook (see Figure 3).
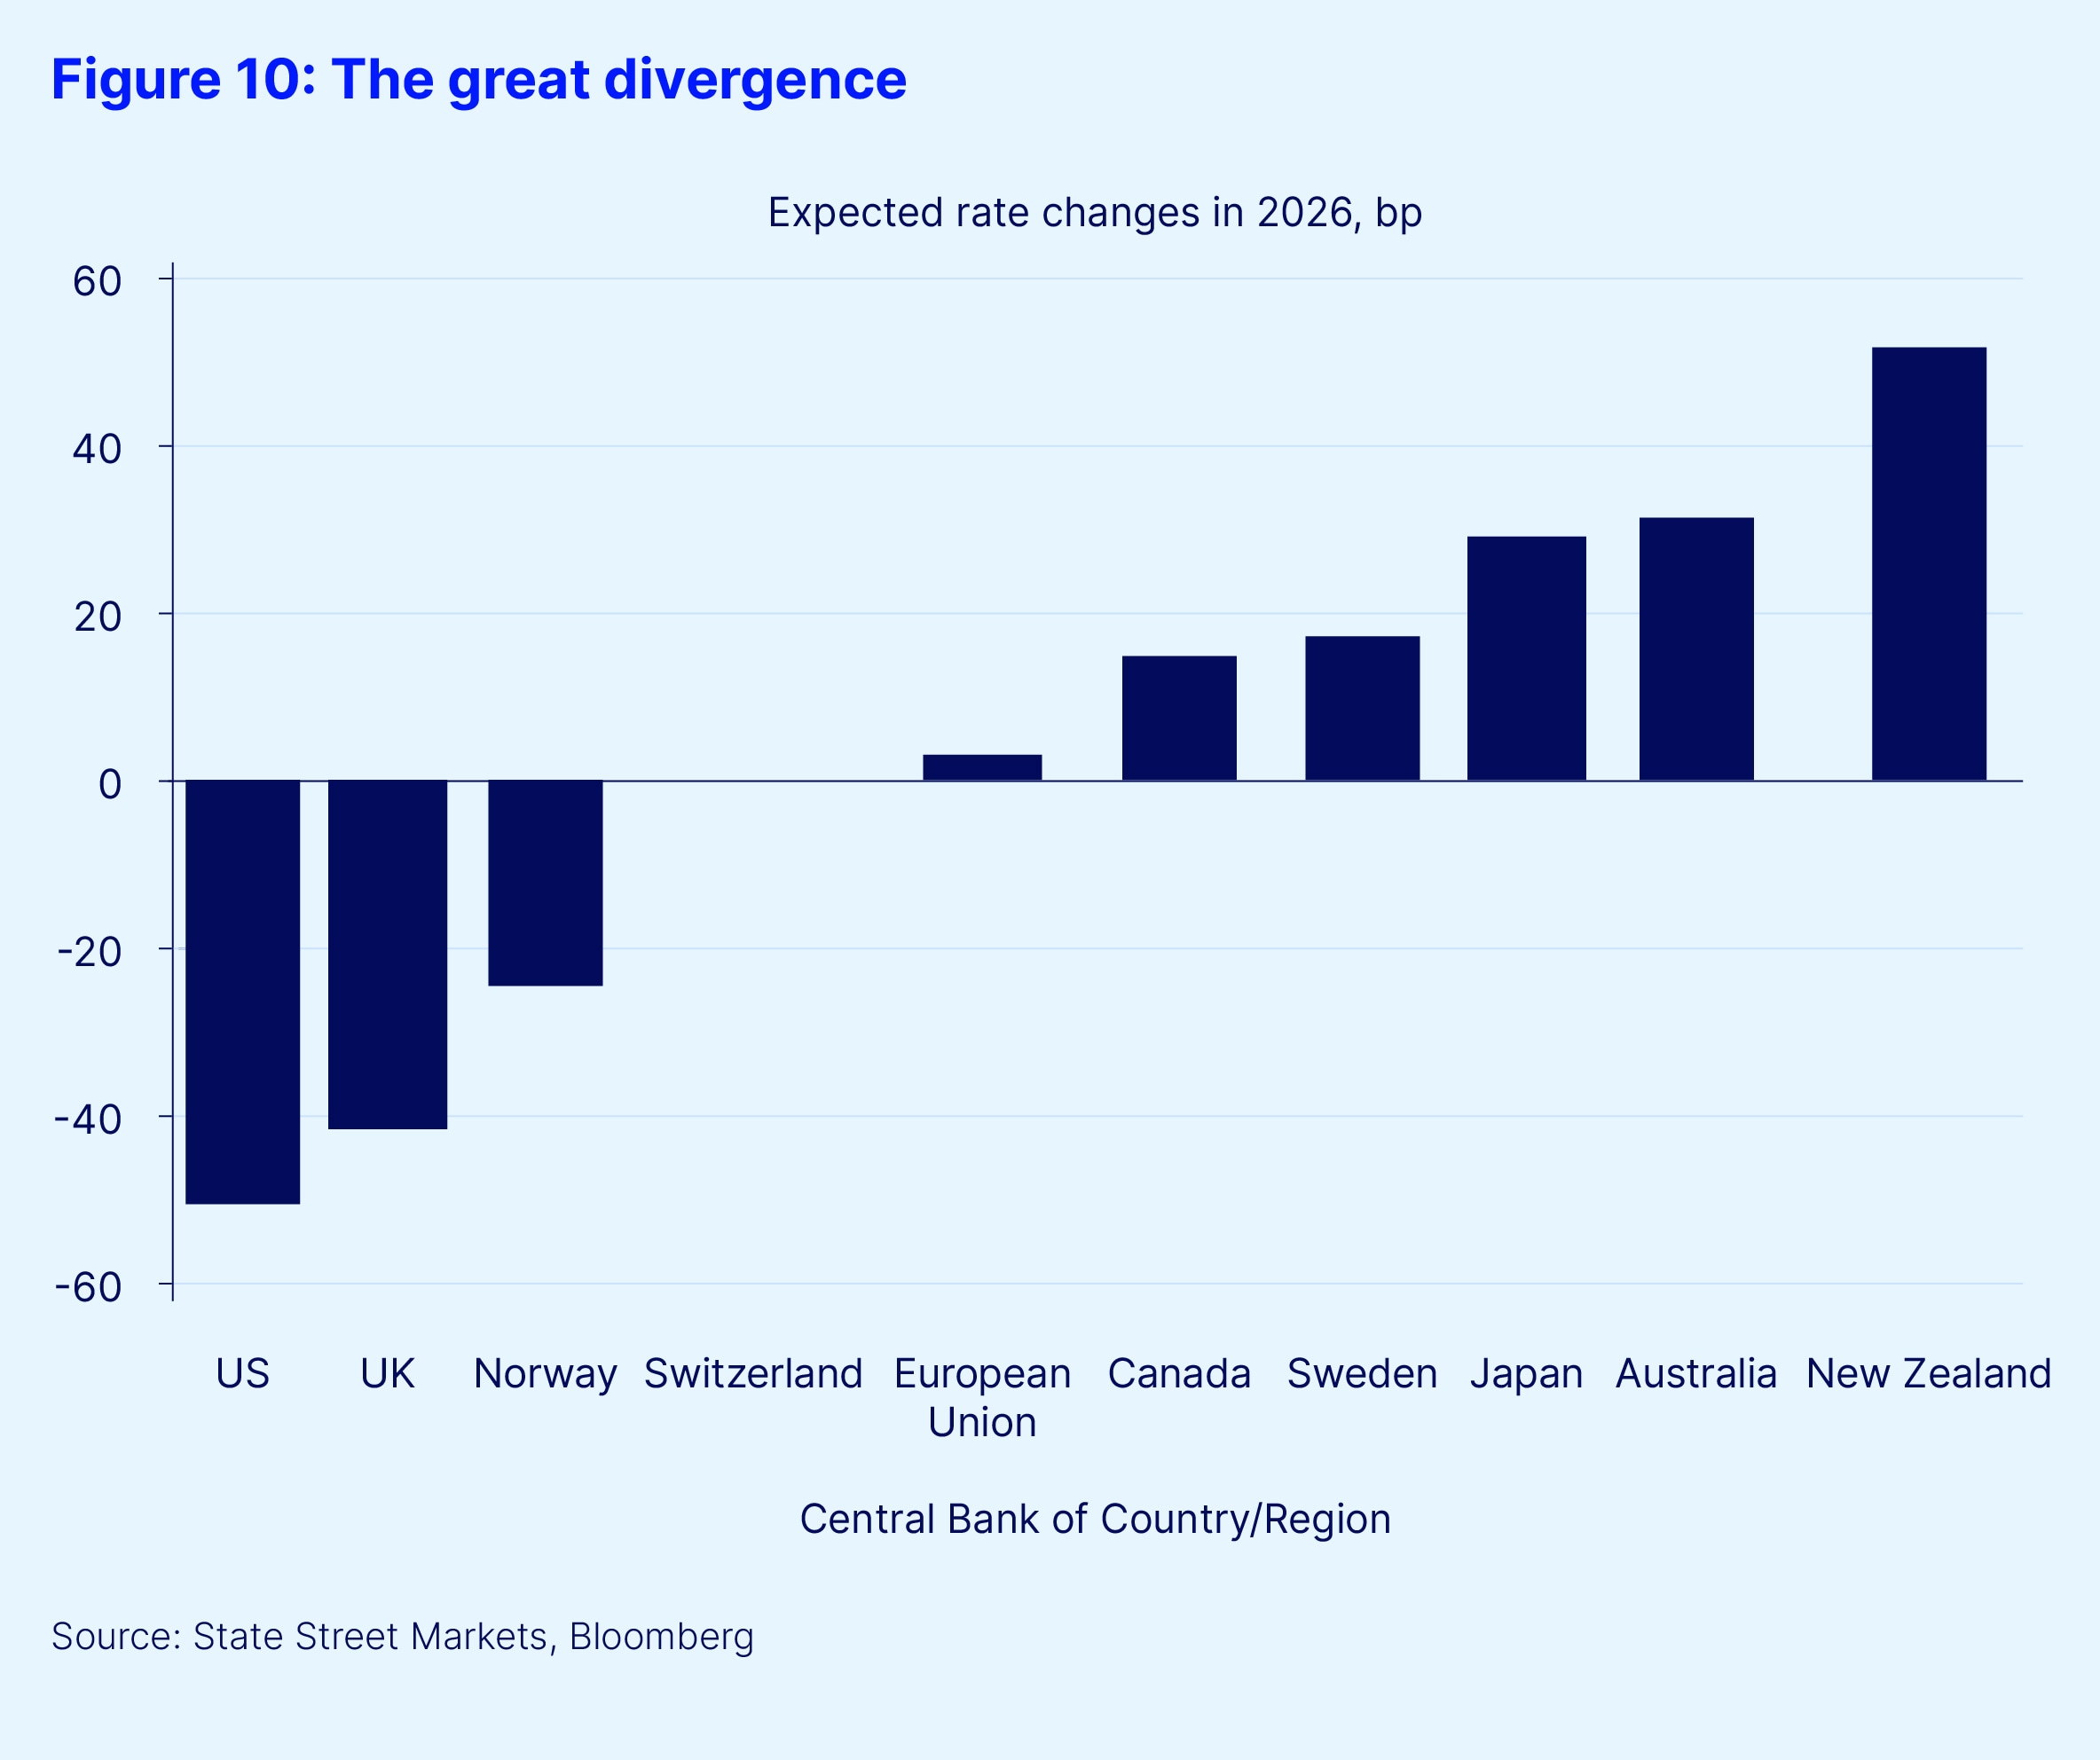
As Figure 10 illustrates, the FOMC is expected to ease by more than any other G10 central bank in 2026. Additionally, five of the G10 central banks are currently expected to raise rates next year. If these consensus expectations are realized, 2026 would represent a very unusual year of divergence in G10 central bank policy. The last time three or more G10 central banks diverged in policy was in 2004. Indeed, since 2019, only the BoJ has moved counter to the majority. Perhaps even more significantly, the Fed is poised to cut rates next year (along with the Bank of England and Norges Bank).
Whether others will hike while the Fed is easing remains to be seen. However, if market pricing proves accurate, 2026 could be an interesting FX year for the USD. In 2004, when the Fed was cutting rates while more than three other G10 central banks were raising rates, the DXY fell by 7 percent, having fallen by 15 percent the previous year.
In answer to the question posed at the start, what goes down does not necessarily have to go up the following year. With overseas USD hedge ratios at historically low levels and the cost of hedging USD exposure set to fall in 2026, a USD bounce in 2026 seems unlikely.
Rerating emerging markets: From cyclical to structural ownership
Ben Luk, senior multi-asset strategist, State Street Markets
Emerging markets had a stellar year in 2025, with double-digit gains across carry, bonds and equities. This rally was due to a combination of external and internal tailwinds, which led to better inflows across the region. A weak USD backdrop, coupled with a significant decrease in cross-asset volatility, encouraged investors in EM, while macro conditions surprised on the upside, thanks to strong demand for AI-related products despite persistent tariff threats. Last but not least, credible central bank policy and prudent government spending underpinned confidence in EMs.
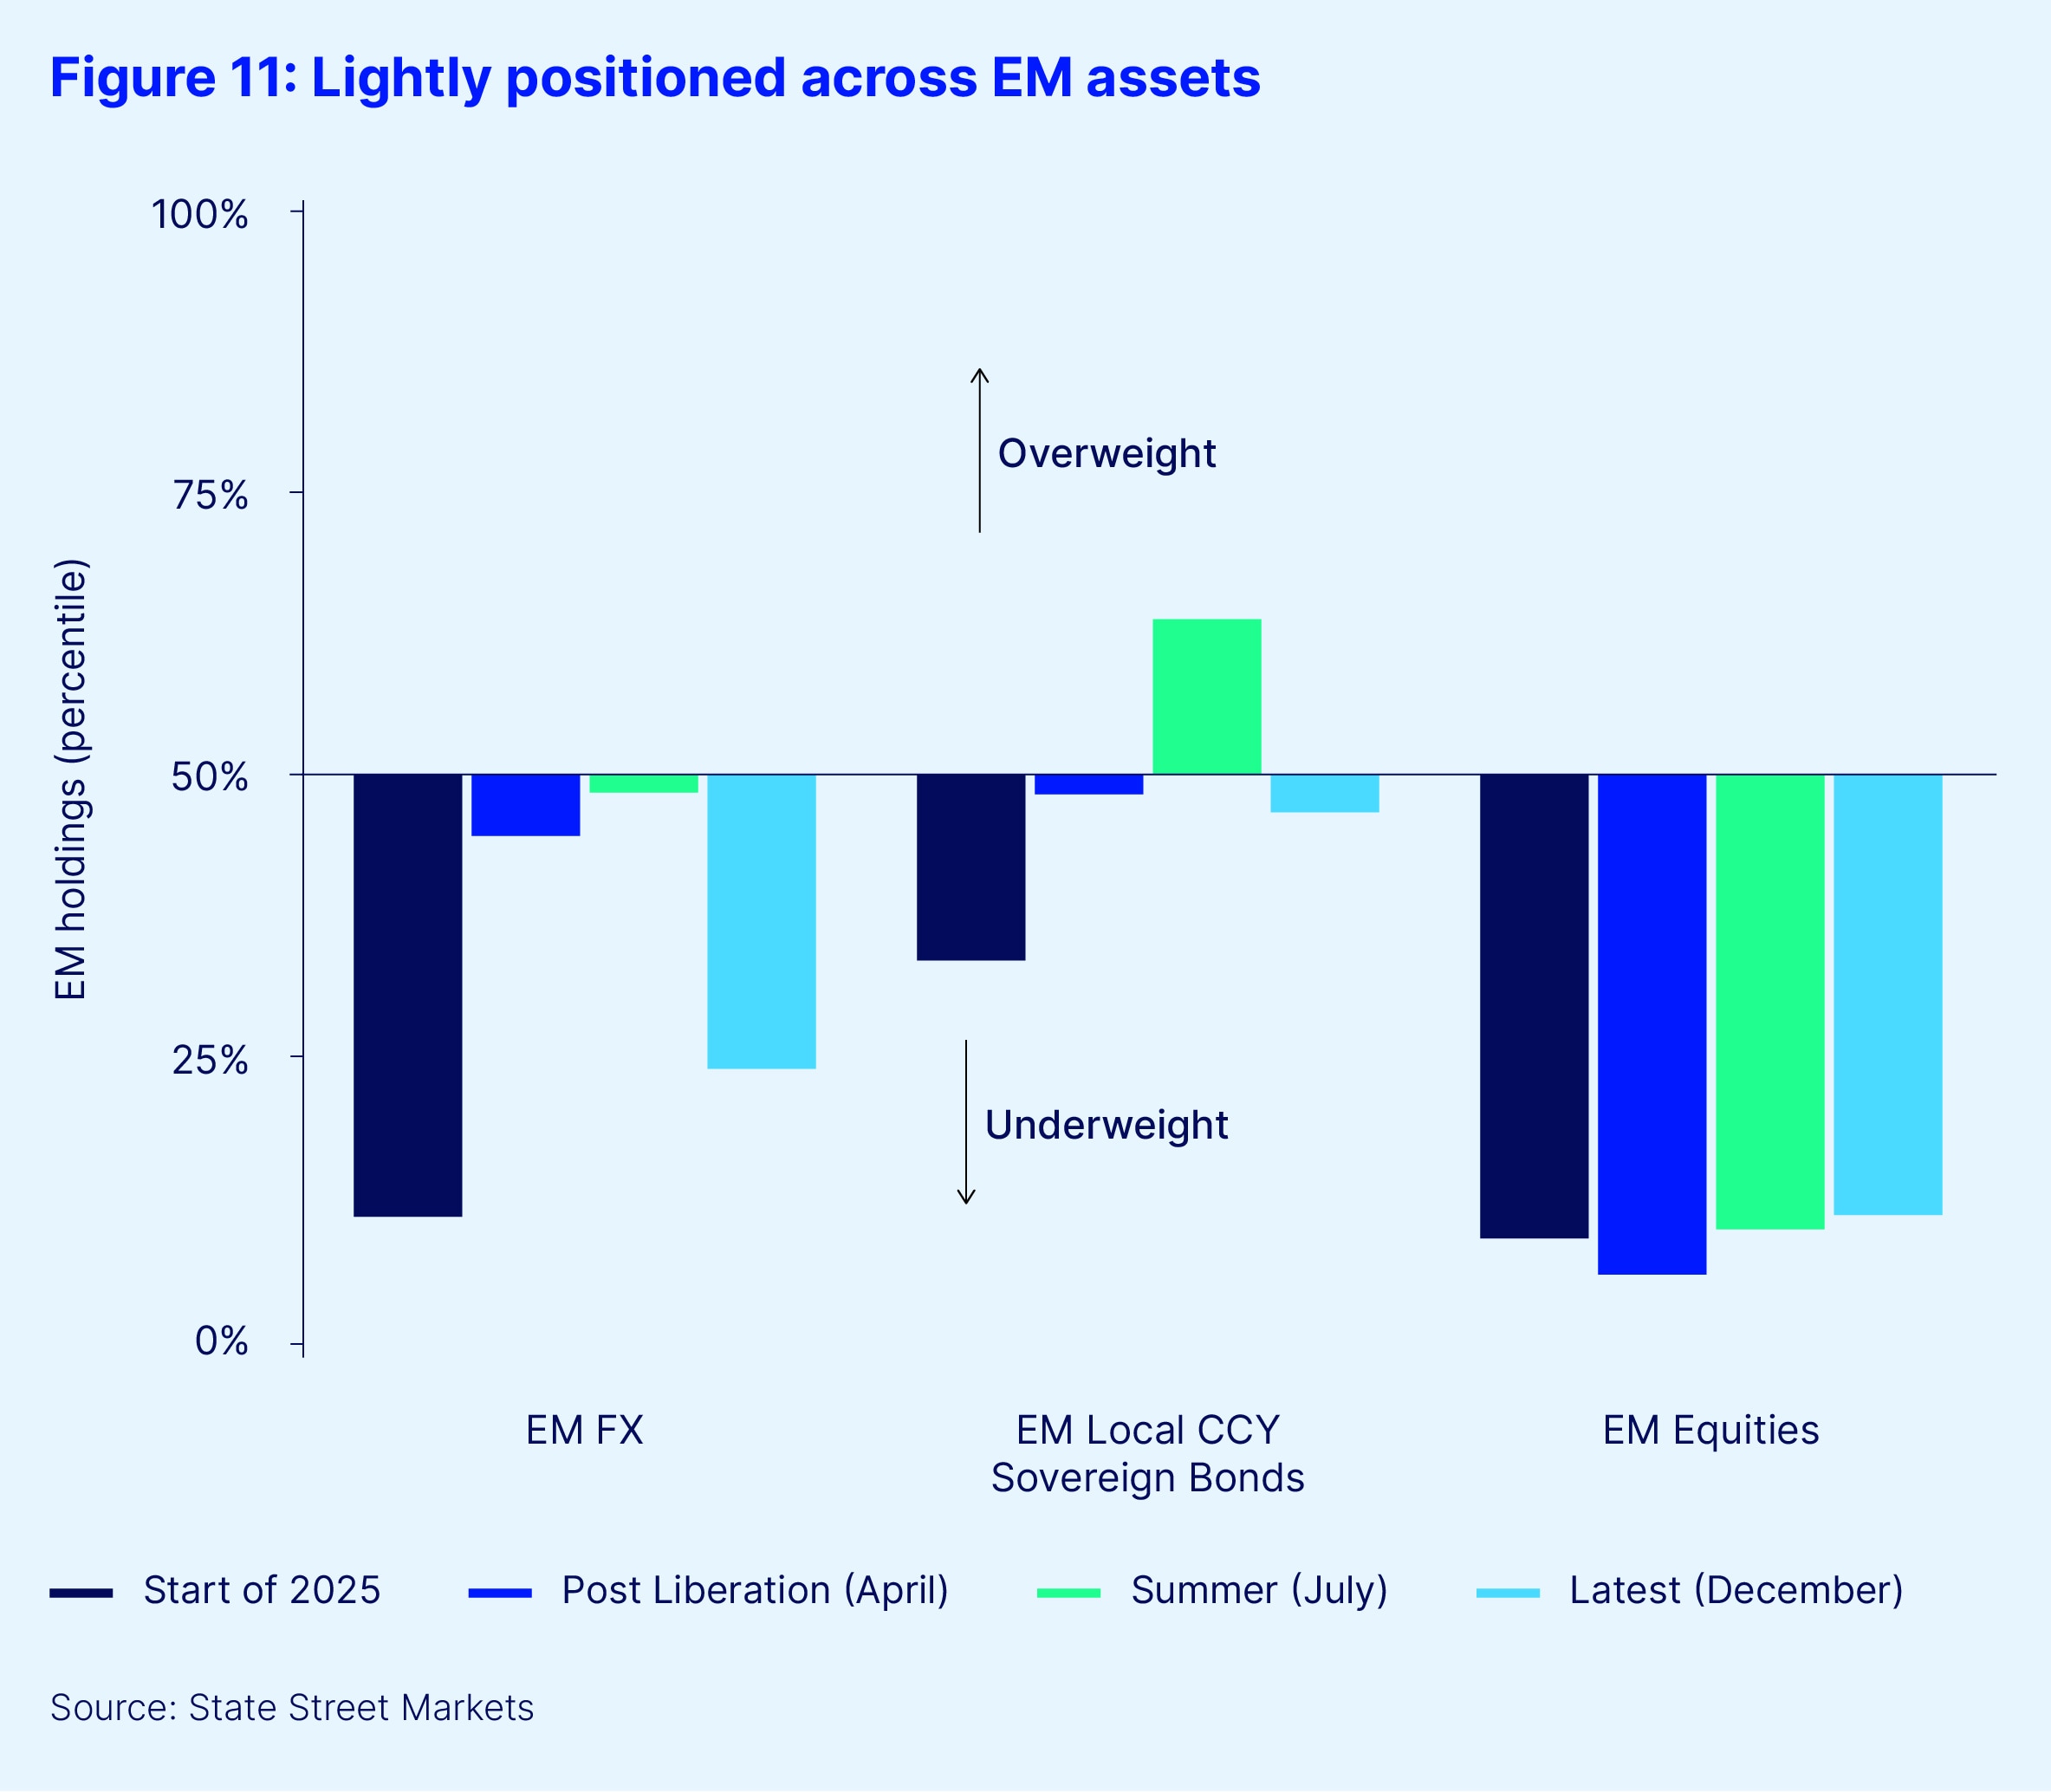
Yet surprisingly, as we begin 2026, according to our Institutional Investor Indicators (see Figure 11), institutional investors have remained on the sidelines with underweight positions across EM FX, local currency sovereign bonds and equities. This makes the region an attractive opportunity for investors seeking to diversify away from overweight positions in both Europe and the US.
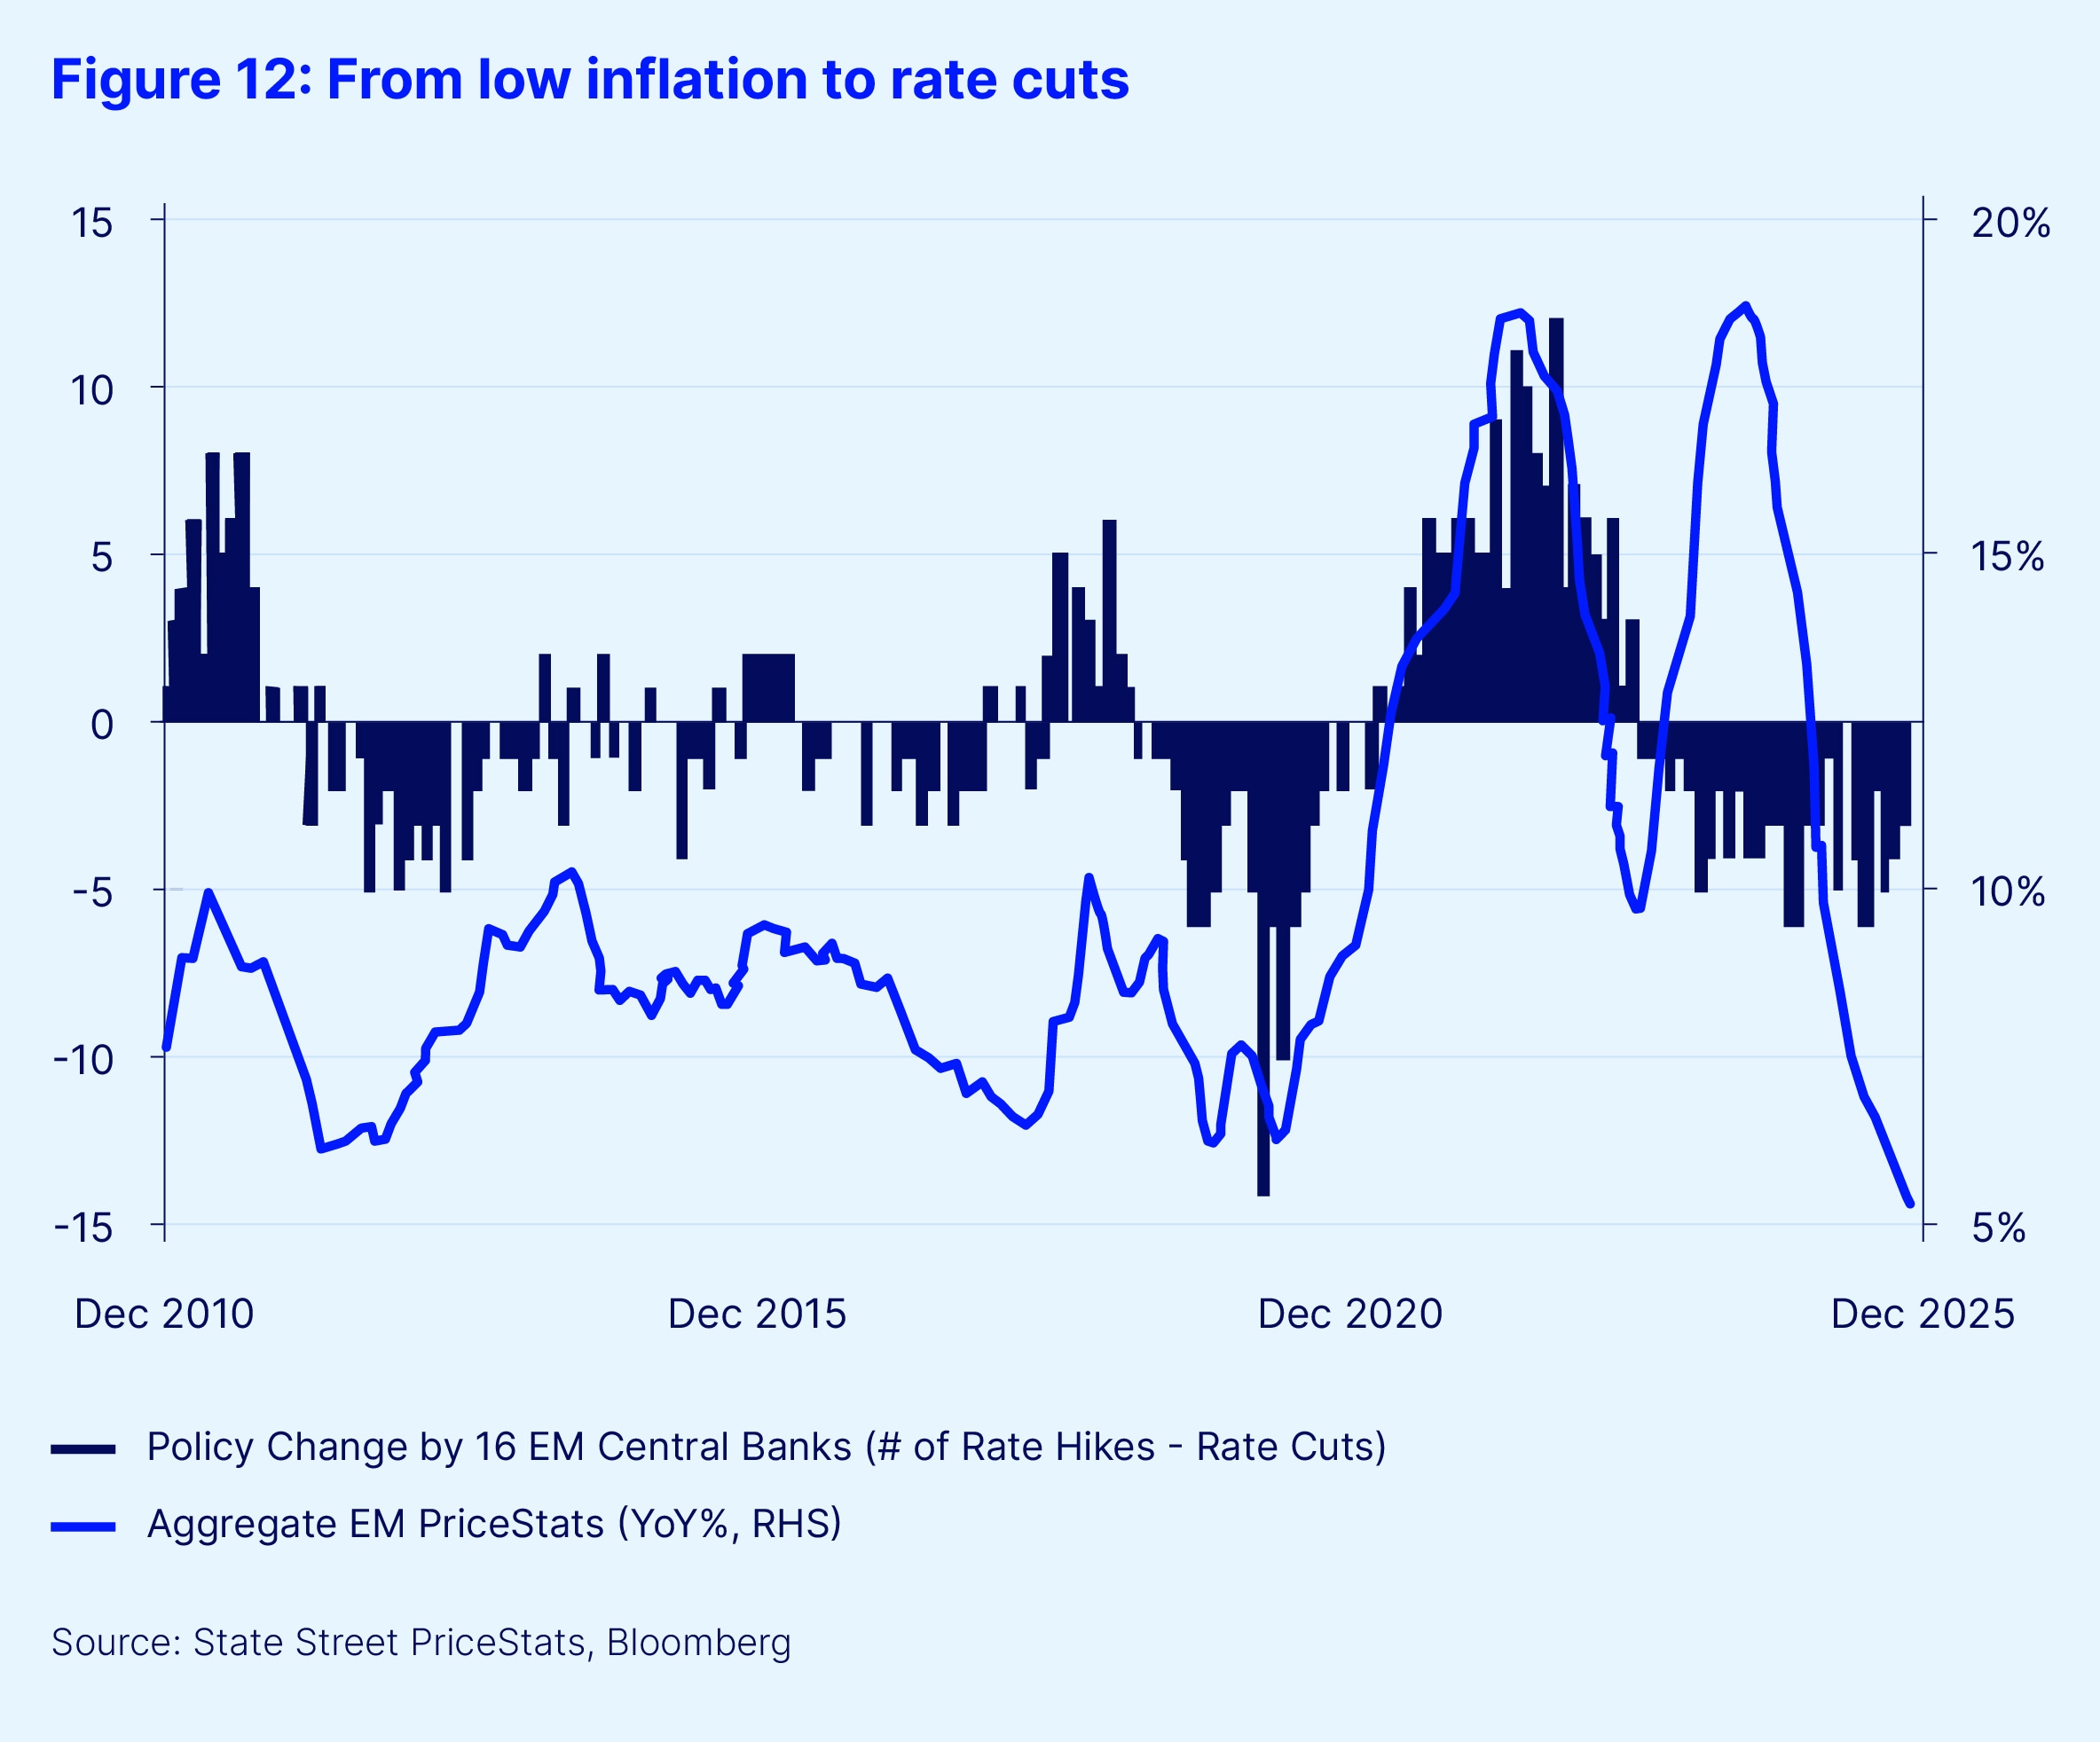
Unlike their developed market (DM) counterparts, EM central banks were not aggressive in easing policies over the past 12 months as they managed to build hefty FX reserves during a weak USD environment to potentially offset capital outflows. According to State Street PriceStats, aggregate EM online prices have fallen 5.2 percent year-on-year — the lowest reading in the past 15 years —whereas DM inflation is back to a three-year high (see Figure 12). This divergence in price dynamics has forced DM central banks to keep rates anchored, whereas EM central banks can still cut rates in the medium term due to lower underlying inflation dynamics — although markets have priced in a lot of easing going into 2026. Moreover, US Treasury movements this year have been driven not only by cyclical factors, but also by structural concerns such as debt sustainability, central bank independence and the future trajectory of Fed Chairman Powell; still, EM bonds have demonstrated resiliency in 2025.
We anticipate EM yield differentials to compress further in 2026. However, active management will be essential to determine which countries and which parts of the curve to invest in, as idiosyncratic factors such as elections, defaults or renewed geopolitical tensions may arise — even if EM central banks collectively look to extend their easing cycles. Investors should consider this asset class not as a cyclical trade, but as a long-term strategic allocation, as foreign ownership remains well below long-term average.
Monetary policy serves as a foundation for the stability of EMs, but what matters in the long run is economic growth and trade. World trade has continued to strengthen despite tariff threats, while economic surprises in EM have turned positive since the start of the fourth quarter 2025. In 2026, gross domestic product (GDP) growth in EM is expected to remain unchanged at 4.1 percent, similar to growth levels seen in 2025 and 2024.
We expect EM exports to remain resilient in 2026 given the ongoing surge in AI and chip innovation, as China, South Korea and Taiwan are the major beneficiaries of the global technology cycle. However, China’s growth will likely remain under pressure due to geopolitical tensions with the US (and most recently, Japan), but this could force Beijing to be proactive instead of reactive. Policymakers are focused on policies to fight against deflation, and Beijing should encourage consumer spending, self-sustainability and high-value-chain manufacturing, as well as provide indirect support to the property and labor markets. We see the potential for continued positive equity performance in 2026, as corporate earnings improve due to Asian tech proxies while investors take advantage of the deep valuation discount relative to US equities.
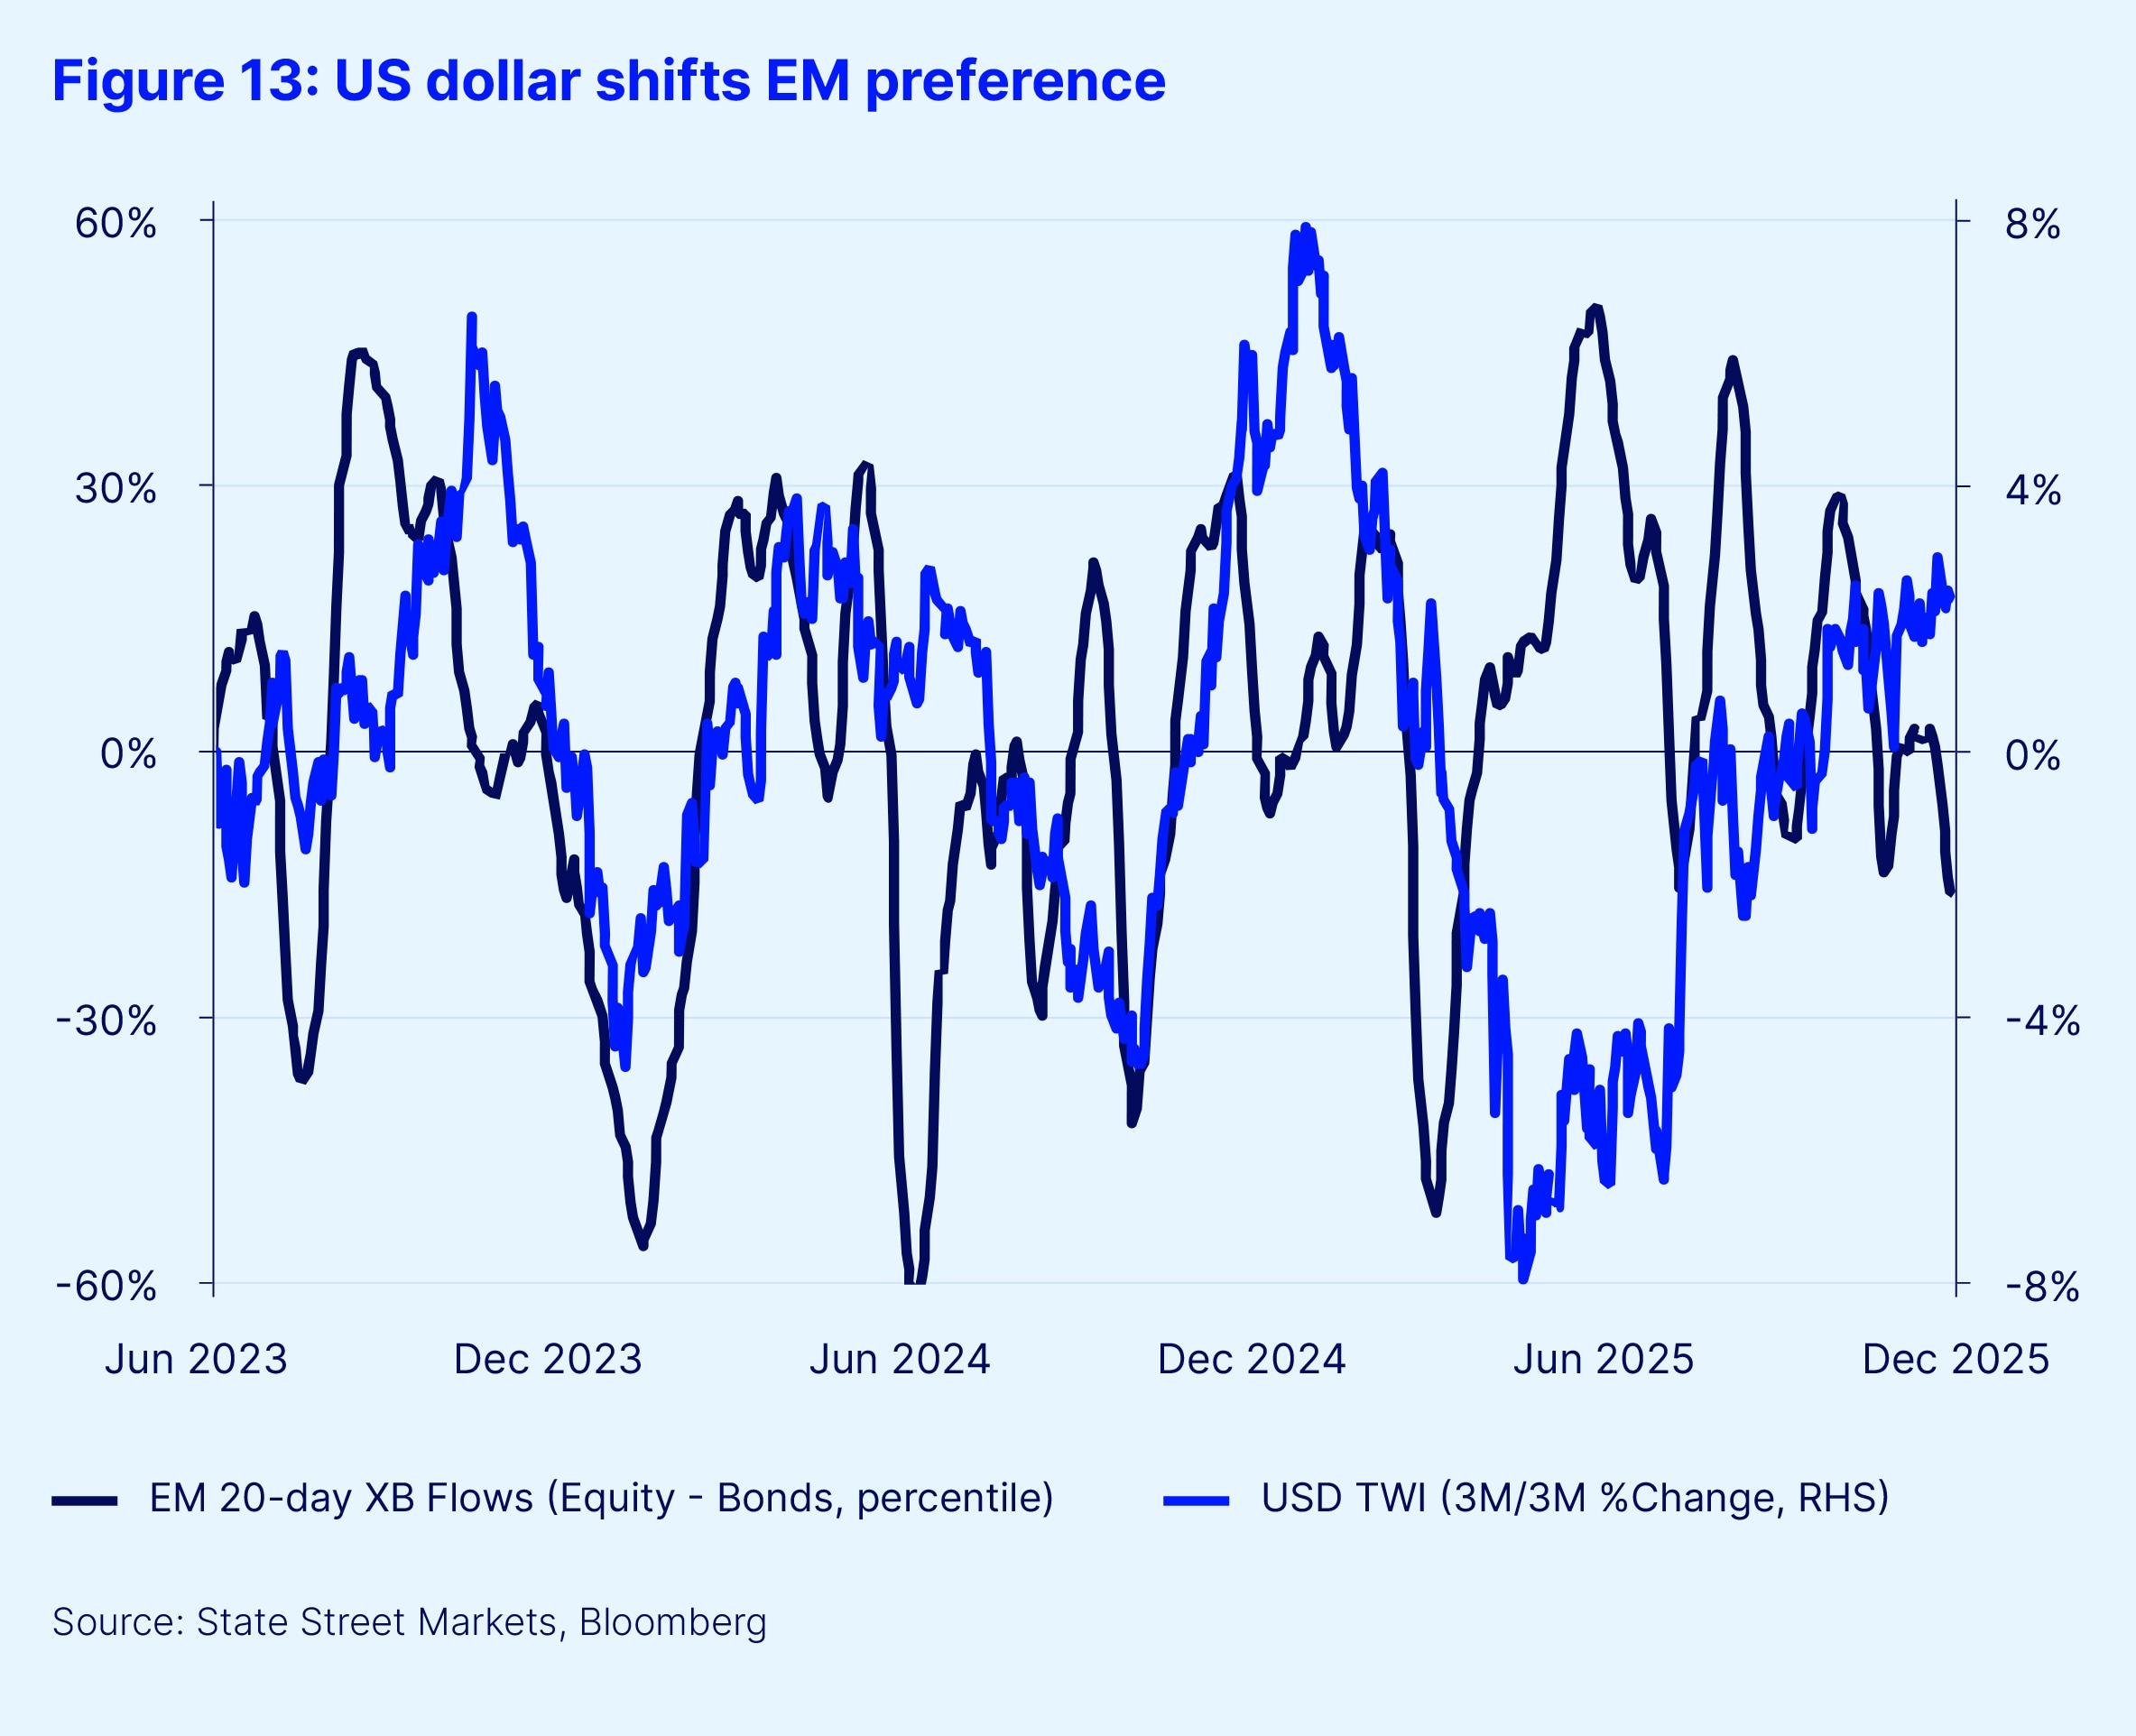
The biggest concern for EM has, and will always be, renewed USD strength — although not all EM assets are as vulnerable. As we track real money flows over time, we have observed a rotation in investor preference of EM equities over bonds in a rising dollar environment, but not a diversion from the entire region (see Figure 13). EM bond managers are more sensitive to USD strength, as gains in FX would be wiped out and spreads would widen while hedging costs would increase. On the contrary, weaker EM currencies can still benefit from equities if this translates into stronger exports and greater market share — ultimately leading to higher earnings growth.
Investors have aggressively sold EM in the past, given a downturn in growth and a lack of accountability from central banks and the government — but the EM of today are not the same as in the past. Credible policy management and improving fiscal balances, coupled with steady macro conditions, indicate that EM as a whole deserve more attention, especially for investors looking to expand their risk spectrum and increase their diversification. As we enter 2026, EM as an asset class remains extremely under-owned and undervalued.


