
Insights
State Street PriceStats: Inflation downshift stalls

United States inflation lost some of its downward momentum in July, even as the annual rate continued to moderate.
August 2026
The State Street PriceStats US index rose a modest 0.07 percent in July on a non-seasonally adjusted basis (NSA) — a rebound from June’s 0.18 percent dip — while annual inflation continued easing from its May peak of over 5 percent, settling at 4.24 percent by the month’s end.
Transportation remained the primary driver of aggregate trends. Continued fluctuations in oil prices drove a fall in that sector series of roughly 0.5 percent month-over-month (MoM), though renewed price pressures at the pump last month kept annual transportation inflation at nearly 10 percent year-over-year (YoY). Elsewhere, the picture was mixed. Recreation and culture prices rose 0.31 percent, household equipment increased 0.23 percent, and food prices edged up 0.22 percent, while apparel reversed June’s gains with a seasonally-typical 0.37 percent MoM decline.
State Street PriceStats enables daily inflation measurement with just a three-day lag, offering timely insights that complement traditional government statistics. It serves as a valuable leading indicator and is especially useful during periods when government releases are delayed or unavailable. Its daily insights are increasingly relevant for policymakers, investors, and analysts seeking to track inflation dynamics in real time.
Covering over 27 countries and multiple sectors — including food, health, and transportation — State Street PriceStats uses consistent methodologies to ensure its indicators are comparable across geographies, time periods, and official data sources.
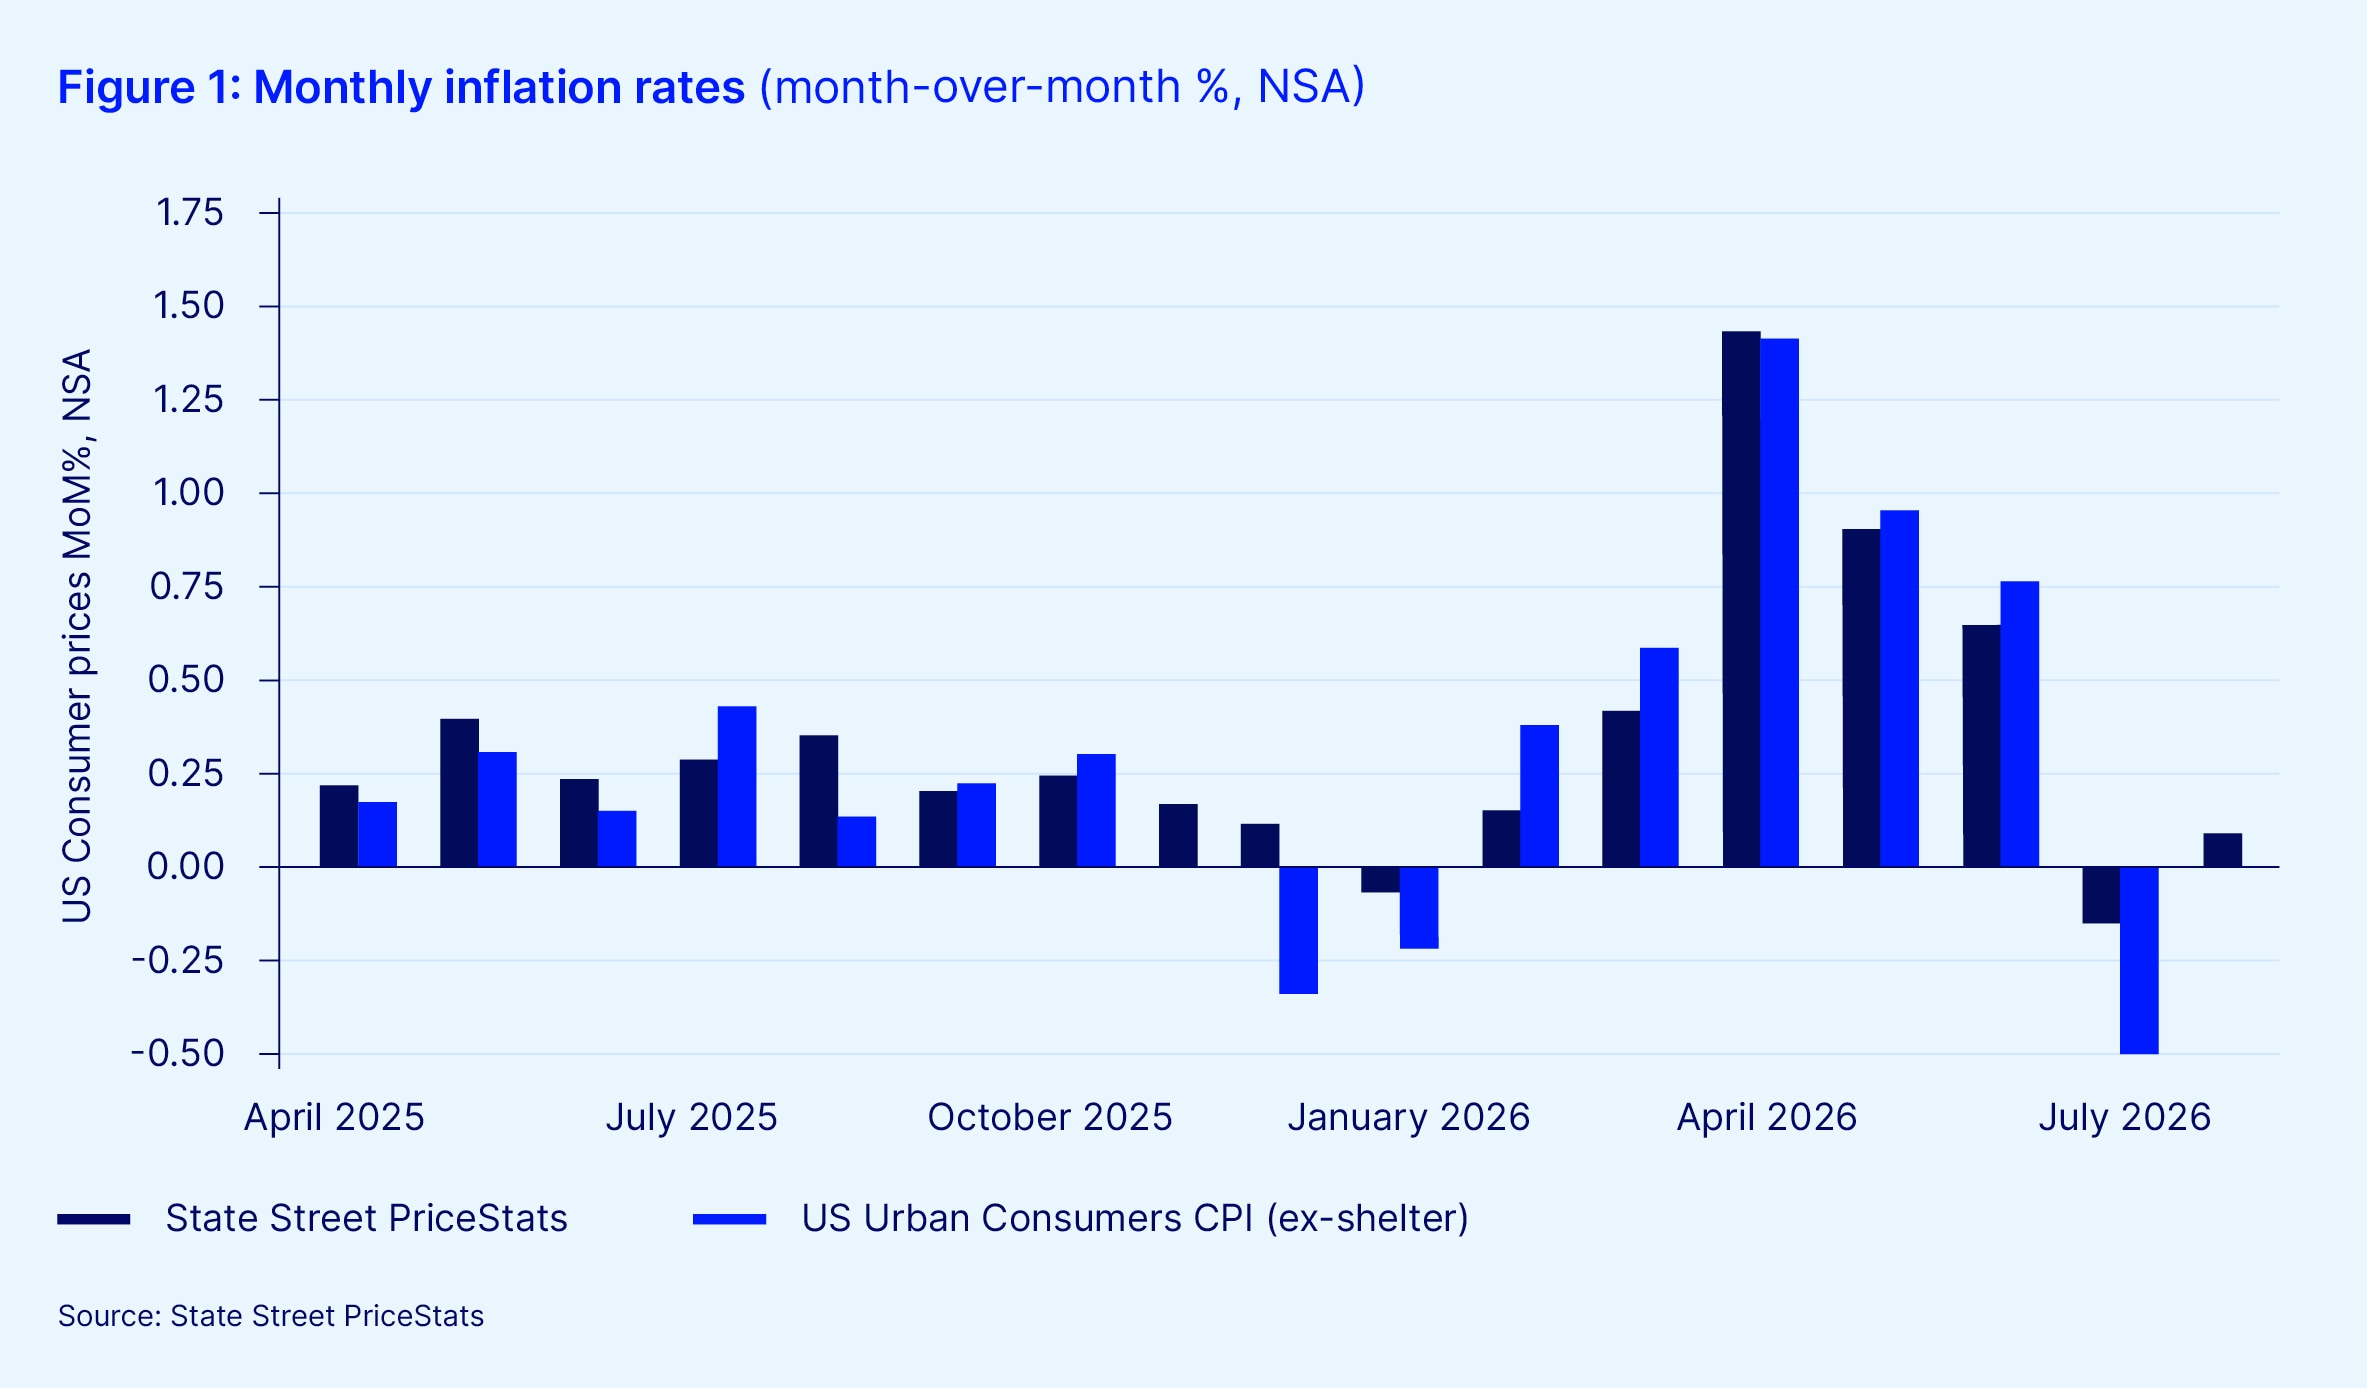
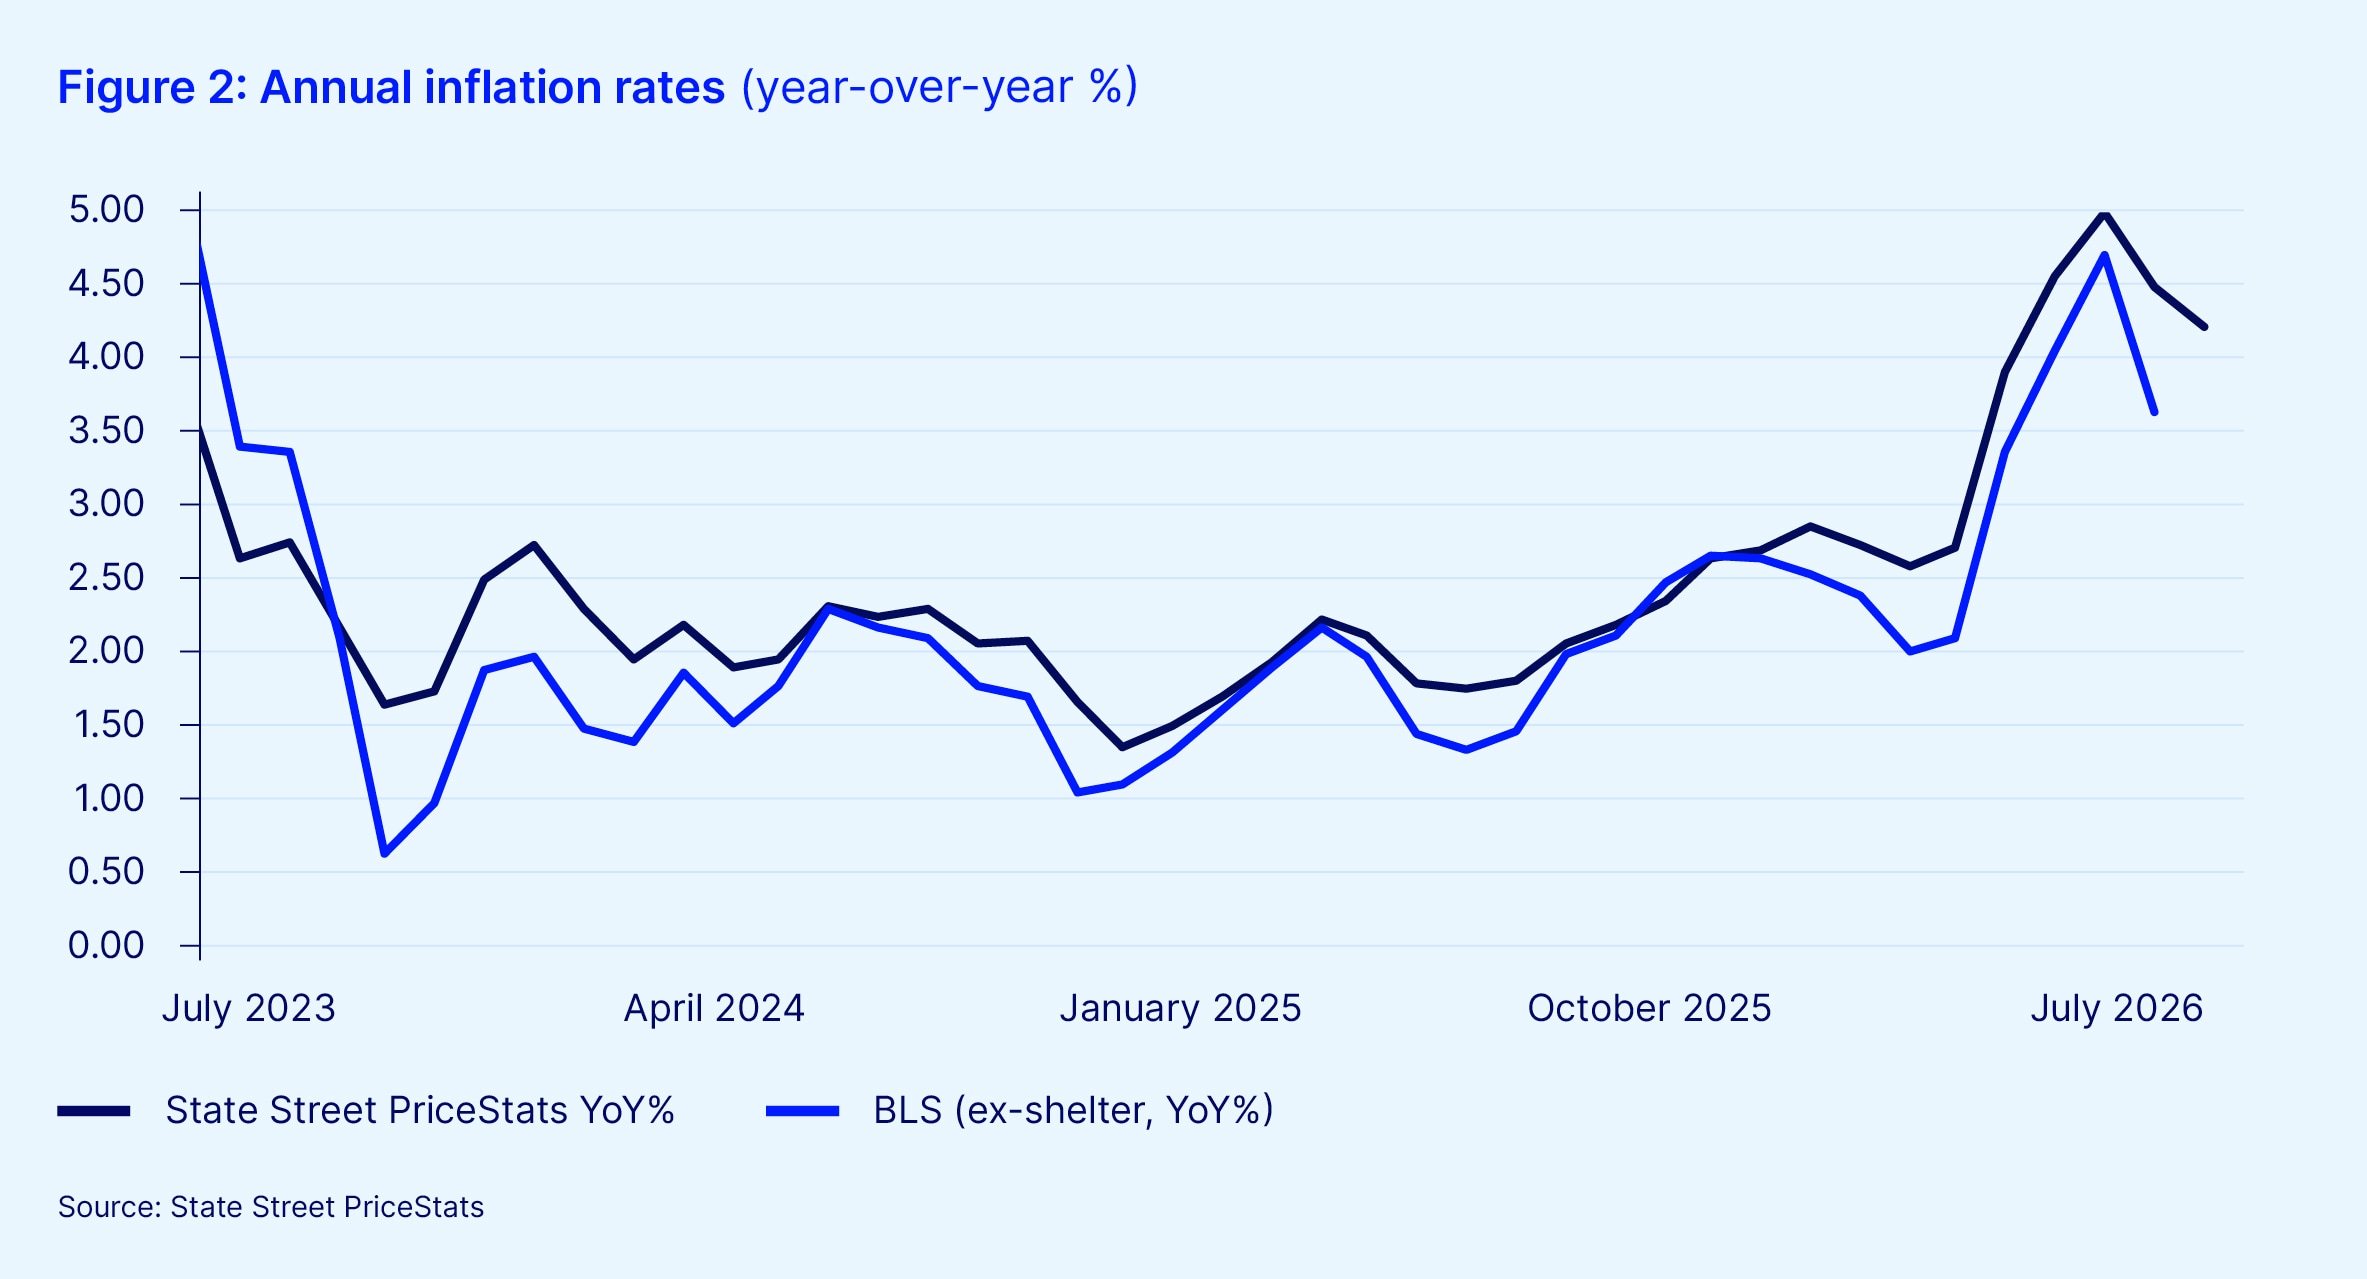
Two factors help explain the shift in inflation momentum between June and July, though the broader trend is still one of gradually easing price pressures.
First, a sharp drop in wireless telephone services was an important driver of the softer June consumer price index (CPI) reading. The Bureau of Labor Statistics’ (BLS) communications component fell in June, with the wireless telephone services index dropping roughly 3.3 percent from May to June after climbing 2.2 percent in May. That category-specific weakness weighed on headline inflation and contributed to the particularly soft inflation reading in June.
Another factor is the rebound in gasoline prices in July. While transportation prices remained a drag on inflation, the decline was considerably smaller than in June as fuel prices recovered. Wholesale oil markets remain unsettled, and July’s vehicle fuel price increases reversed nearly half of the decline from May’s peak. At the end of July, fuel prices were roughly 38 percent above where they were in late February — though the pace of those increases was beginning to slow in the latter half of July. With continued instability in oil markets, annual inflation from transportation appears to have peaked for now, even as fuel prices stay elevated.
Taken together, the July data points to a slower pace of cooling rather than renewed inflation. With some of the temporary drags that weighed down June inflation beginning to fade, July's profile looks somewhat firmer than the previous month, even as the broader trend still points to gradually moderating price pressures.
About the State Street PriceStats indicators
The State Street PriceStats series are designed to provide a low-latency and high-frequency view into inflation trends that is comparable to official CPI. The features of the process are as follows:
- Daily online price collection: State Street PriceStats collects price data daily from over 1,500 multi-line retailers using web scraping technologies, focusing on those with both online and physical stores. Research has shown that retailers tend to adjust online prices first.
- Data structuring and cleaning: Models then clean and standardize raw price data to ensure consistency across more than 40 million products, converting unstructured HTML into structured datasets ready for analysis.
- Categorization and quality checks: State Street PriceStats categorizes prices by economic sectors and sub-sectors, calculates performance statistics, and applies a red-flag system with daily manual checks to resolve data anomalies.
- Index calculation using econometric techniques: State Street PriceStats computes daily inflation statistics using proprietary econometric methods and publishes the results with a three-day lag.
- Retailer and product selection: State Street PriceStats selects retailers based on market share and city presence, and includes over 500,000 daily prices — far exceeding the 80,000 monthly prices used by the BLS.
- Use of CPI weights and no quality adjustments: State Street PriceStats applies official CPI weights where possible and adjusts for online data characteristics, calculating price changes only from consecutive observations of identical products without applying standard quality adjustments.
For more information or to request a demo, visit our State Street PriceStats Solutions page.


