Insights
State Street PriceStats shows inflation plateau amid sector shifts

US inflation remained steady in October: Our PriceStats data shows a moderate trend, with food and imported goods rising, transportation prices falling and annual inflation at a two-year high.
November 2025
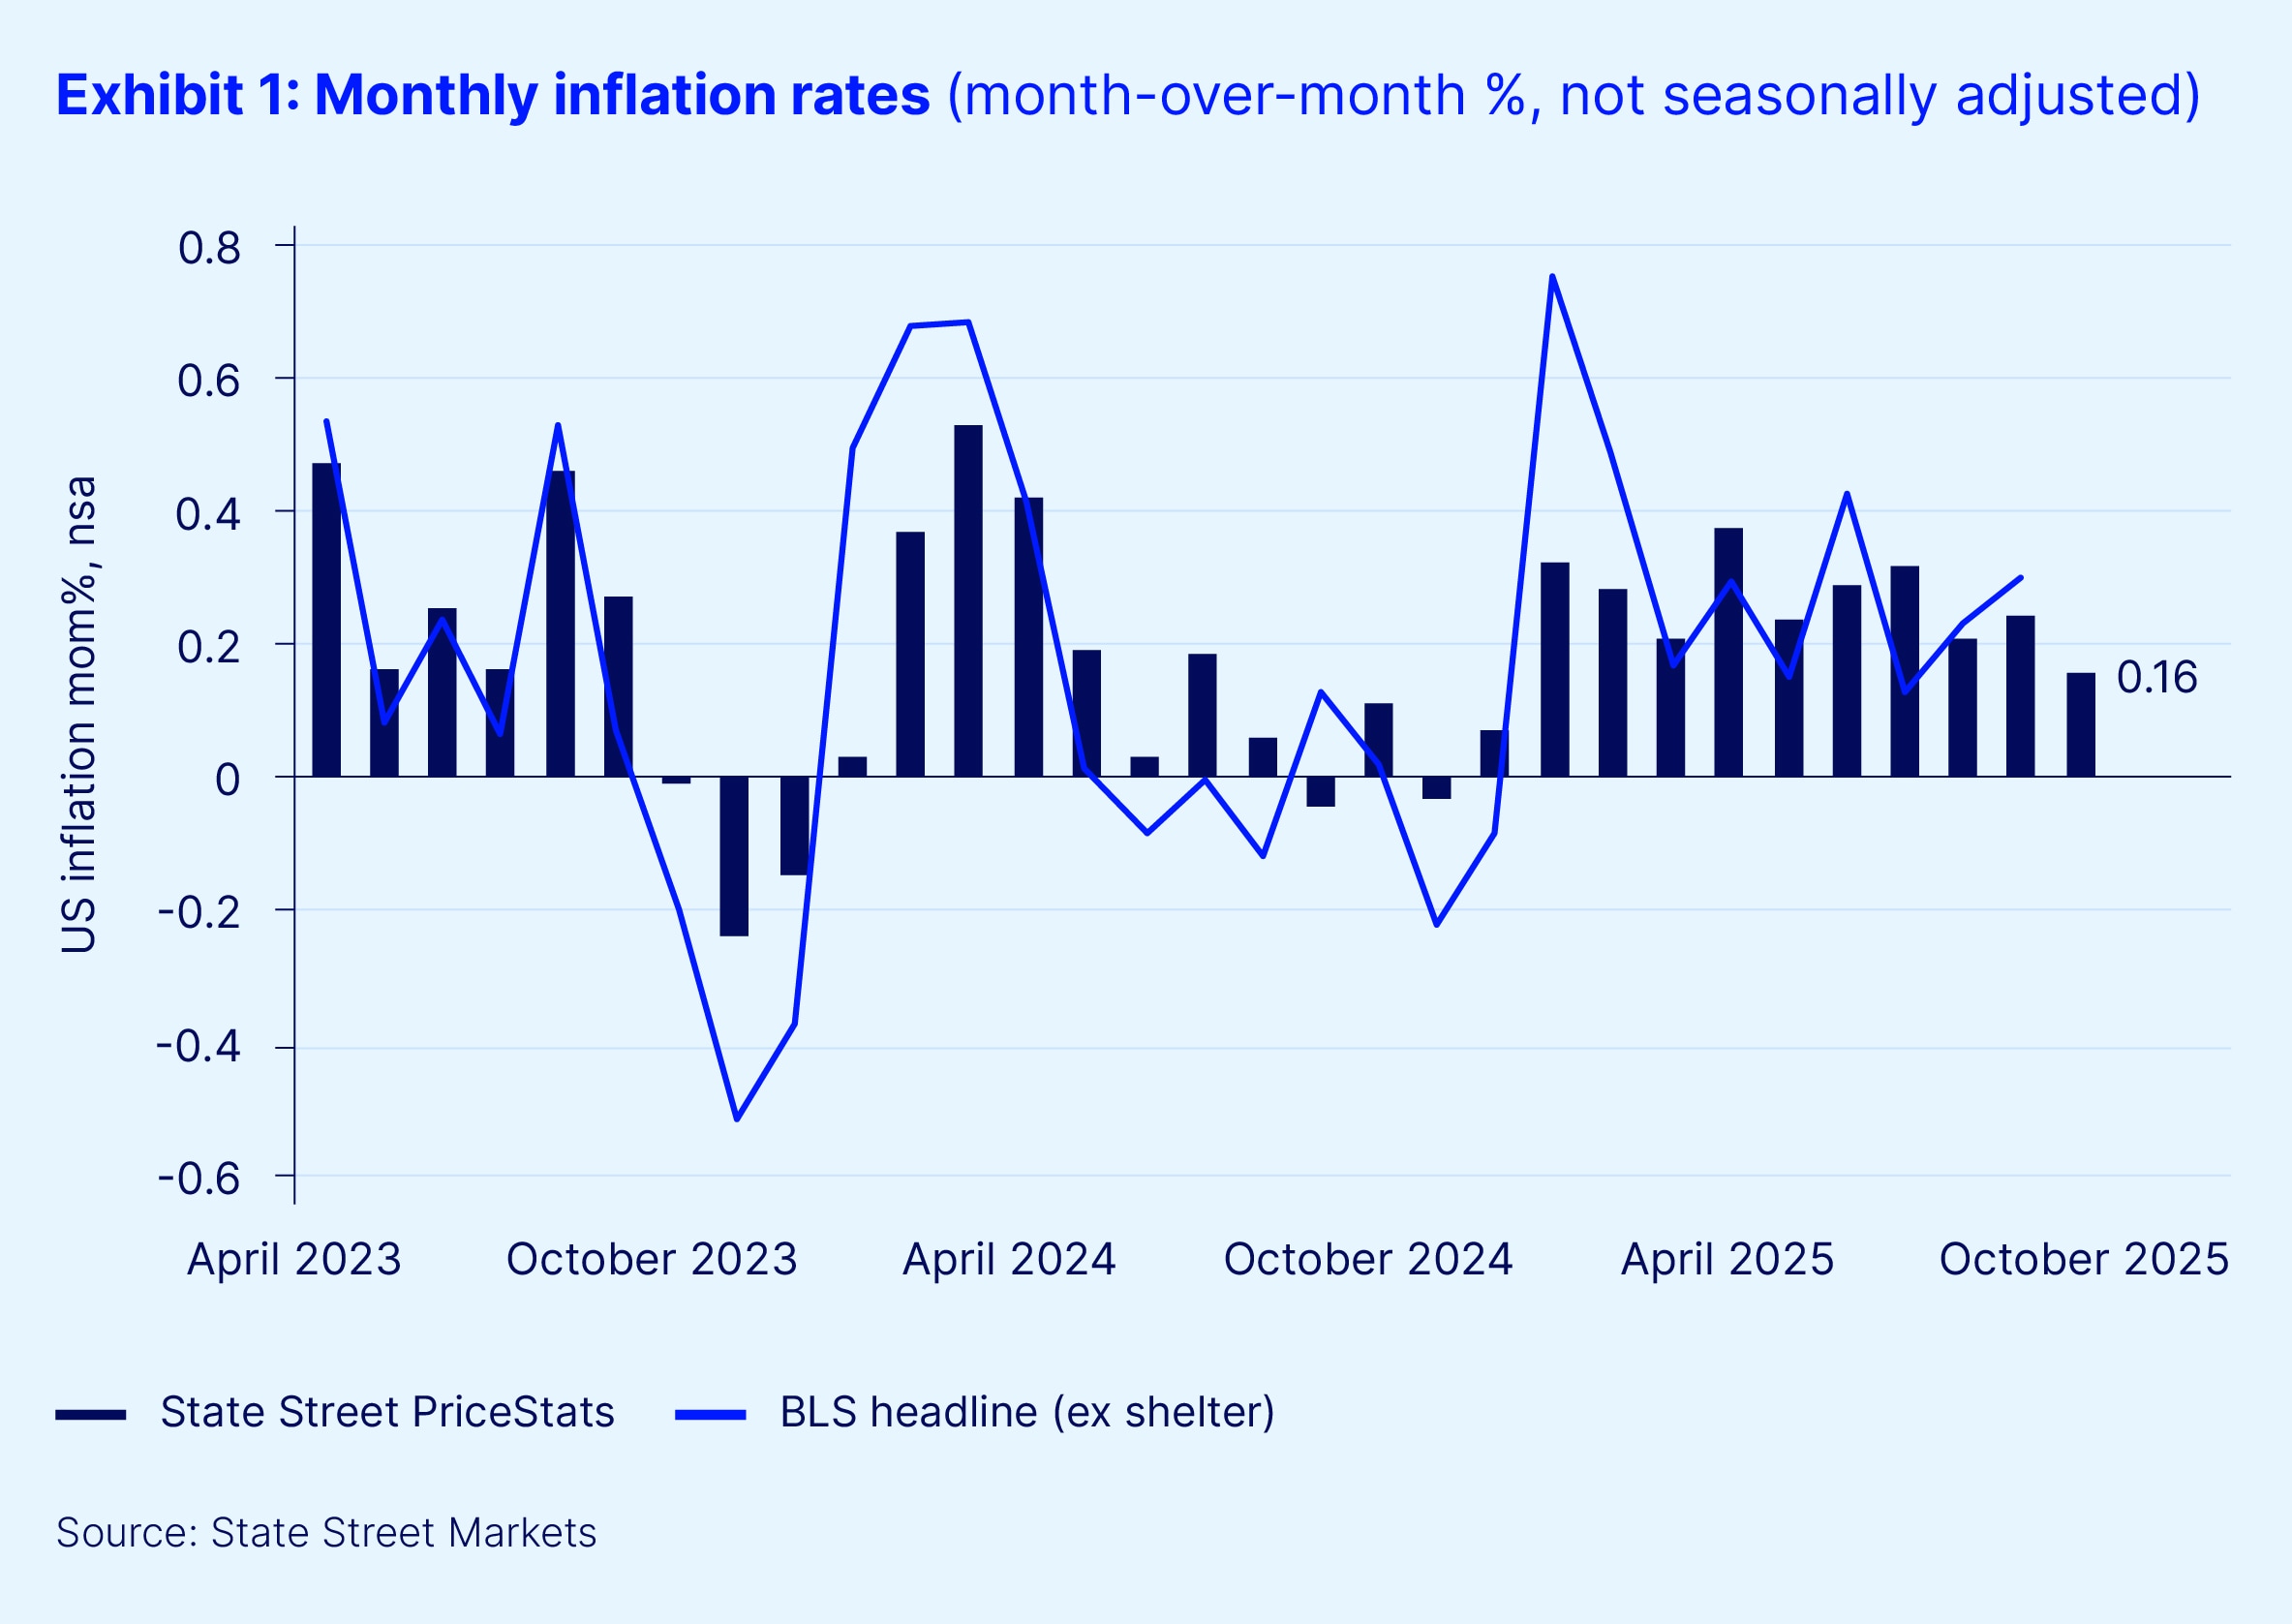
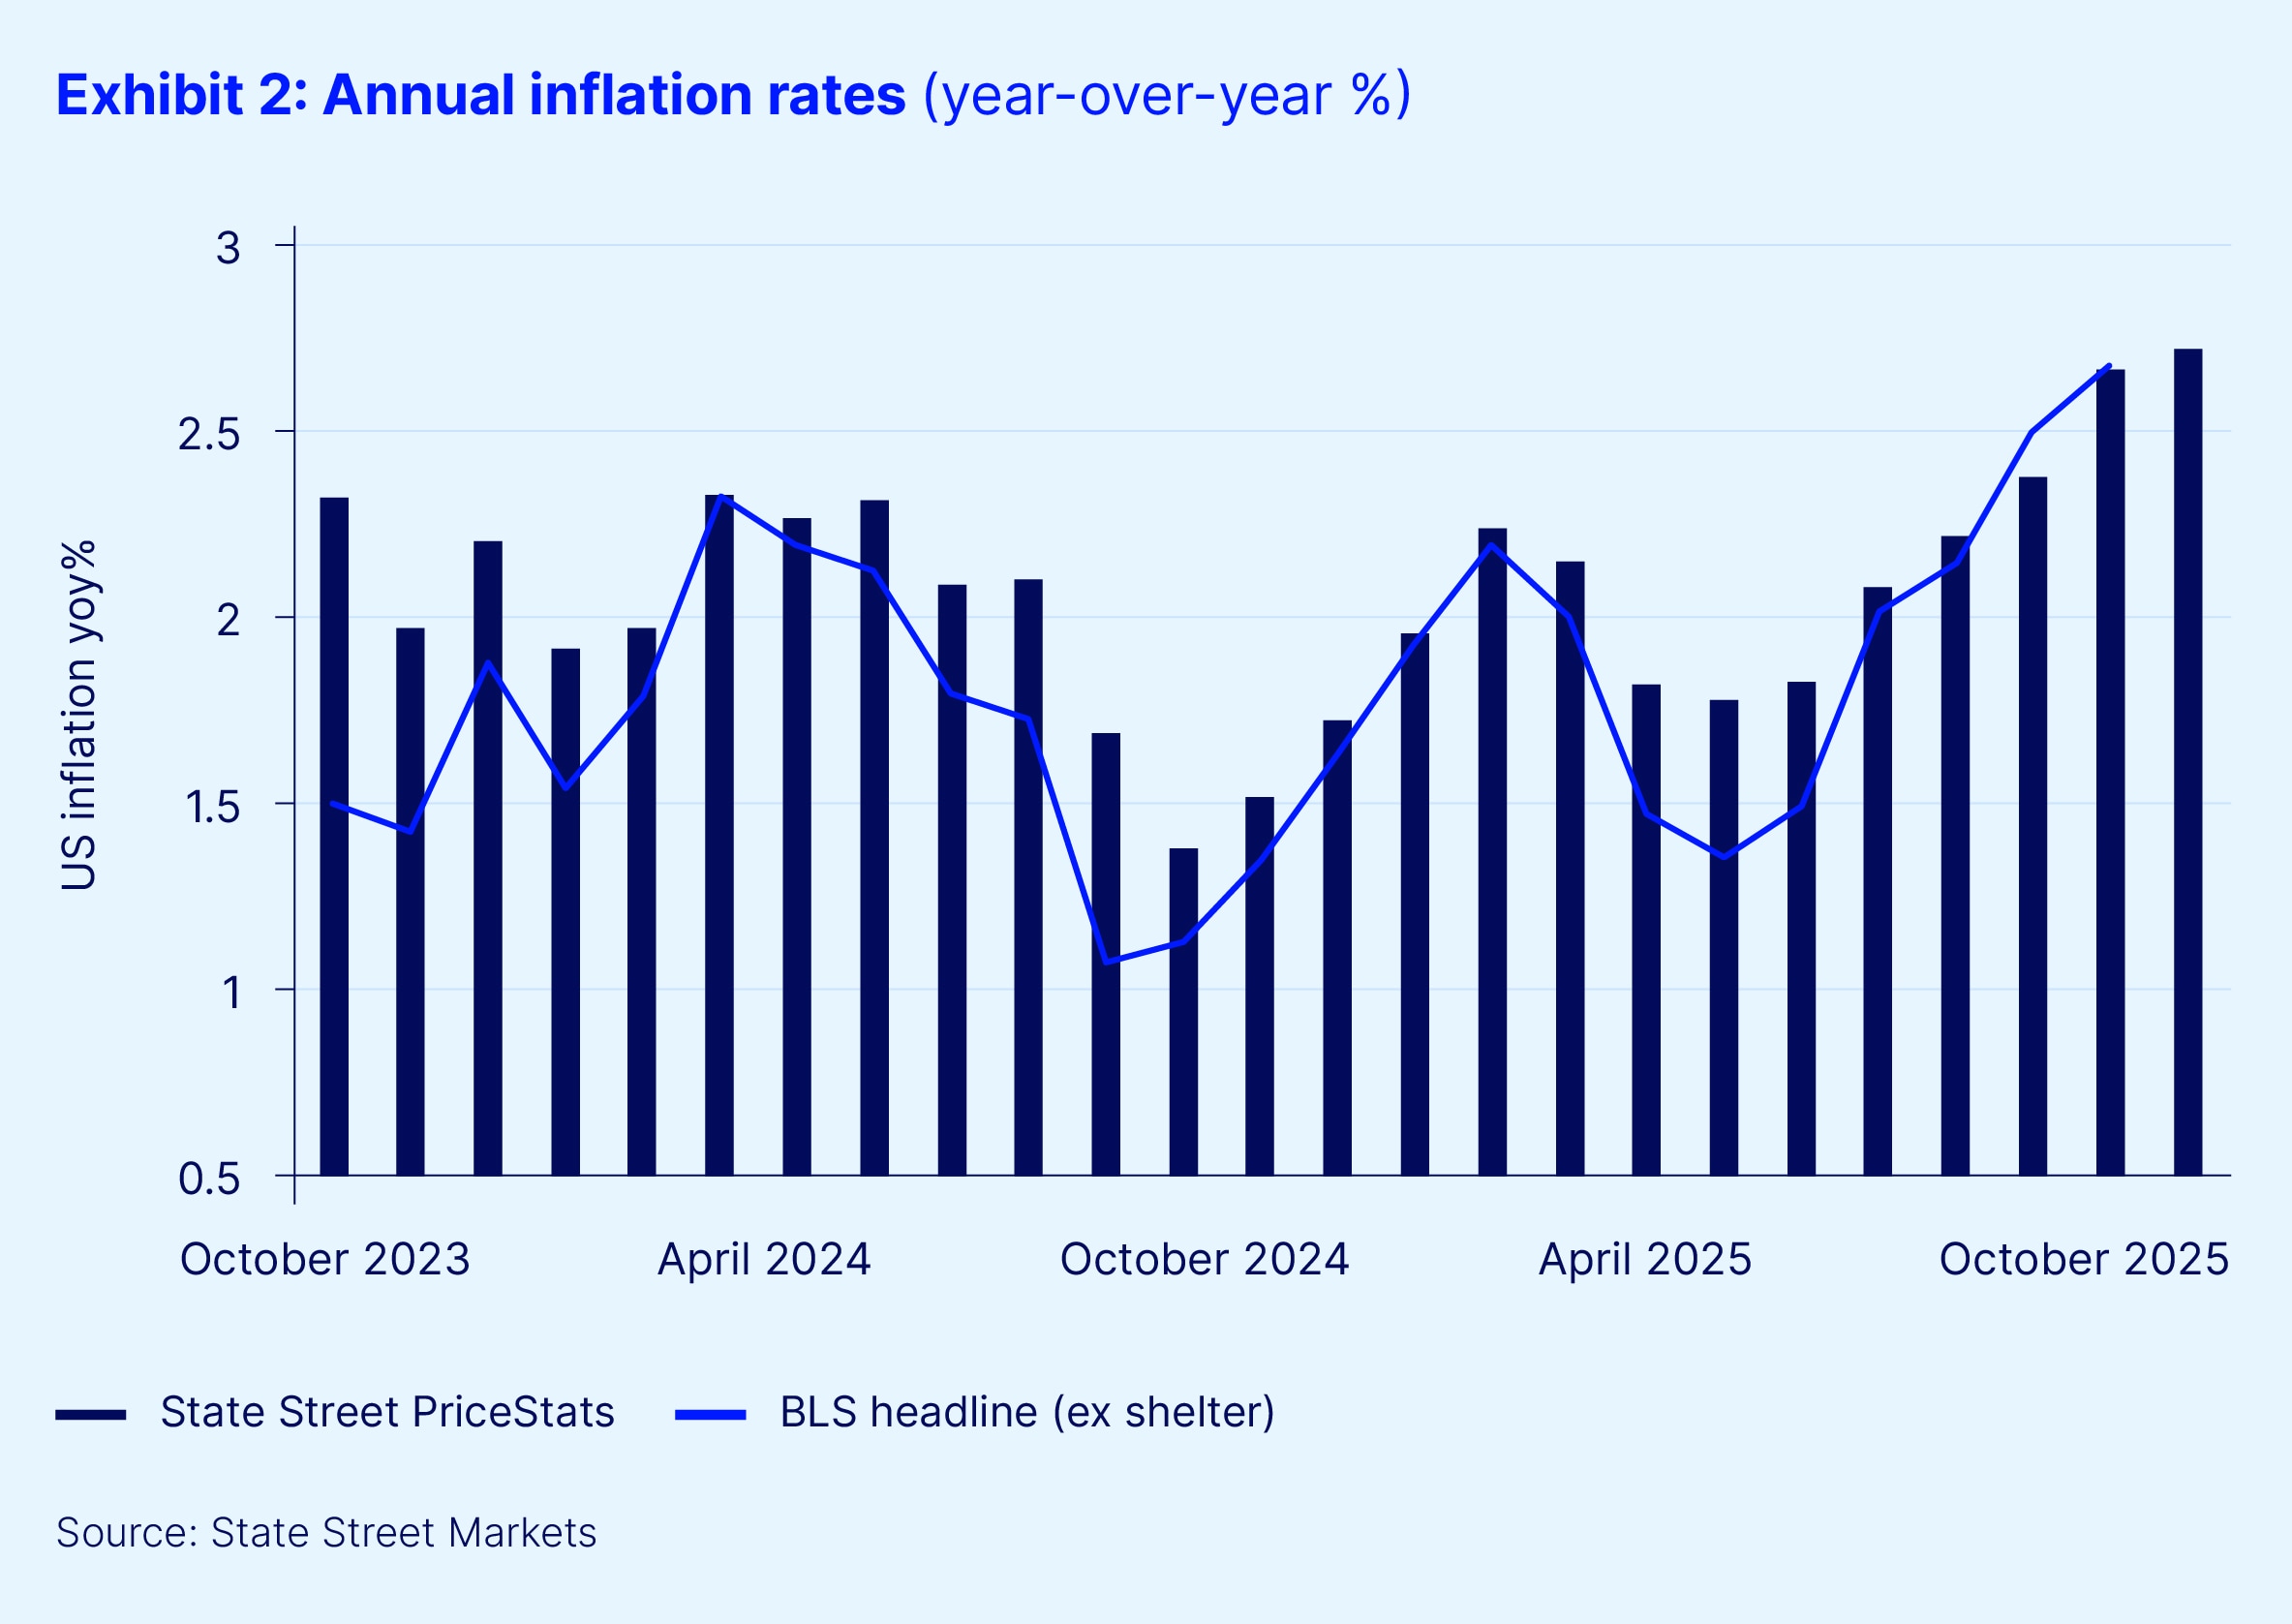
In October, the United States’ PriceStats series rose 0.16 percent on a non-seasonally adjusted basis, following a 0.24 percent increase in September (see Figure 1), nudging the annual inflation rate to 2.7 percent — its highest level since October 2023 (see Figure 2).
State Street PriceStats leverages advanced web-scraping technology to track millions of online retail prices, delivering daily inflation measurements with only a three-day lag. Covering more than 25 countries and multiple sectors — from food and health to transportation — State Street PriceStats applies consistent methodologies to ensure comparability across time, geographies and official data sources.
While alternative data sources like State Street PriceStats are not a substitute for official government statistics, they serve as valuable leading indicators, particularly when official data is delayed or unavailable.
Continue reading for further commentary by Michael Metcalfe, head of Macro Strategy, State Street Markets:
The US inflation trend moderated somewhat in October. A 0.16 percent increase is close to the average for the month over the past decade and similar to the same time last year. After rising consistently since June, the State Street PriceStats annual inflation rate held steady in October, though still hovering near its two-year peak.
Underneath the headline, State Street PriceStats measure sector series showed less stability. They continue to show pockets of firmer pricing in household equipment, furniture and electronics, all of which include a higher share of imported goods than other sectors. The rise in food cost was also stronger than normal for October, which pushed annual food price inflation above 4 percent for the first time since February 2024. This was partially offset by lower transportation prices, which fell by just over 0.5 percent, and a marginally lower-than-normal rise in apparel prices for October.
As we noted in September, given that monthly changes in the State Street PriceStats series show a correlation with the US Bureau of Labor Statistics (BLS) inflation measures in excess of 80 percent over the past five years, this data should serve as a reliable guide for policy makers, consumers and financial market participants in the absence of official data. In September, our reported annual inflation rate from PriceStats was within one basis point of the delayed BLS annual inflation rate (ex-shelter).
Our conclusion is similar to last month. The uptrend in inflation has stalled somewhat in October and aligns with forecasters', including the Federal Reserve, projections for inflation into year-end. This still requires careful monitoring as we move into the seasonal discounting season. For now, inflation remains firm but not frightening.
About the State Street PriceStats daily inflation indices
The State Street PriceStats inflation series are designed to provide a low-latency and near real-time view into inflation trends that is comparable to the official Consumer Price Index (CPI). The features of the process are as follows:
- Daily online price collection: State Street PriceStats collects price data daily from over 1,500 multi-line retailers using web-scraping technologies, focusing on those with both online and physical stores. Research has shown that retailers tend to adjust online prices first.
- Data structuring and cleaning: Models then clean and standardize raw price data to ensure consistency across more than 40 million products, converting unstructured HTML into structured datasets ready for analysis.
- Categorization and quality checks: State Street PriceStats categorizes prices by economic sectors and sub-sectors, calculates performance statistics and applies a red-flag system with daily manual checks to resolve data anomalies.
- Index calculation using econometric techniques: State Street PriceStats computes daily inflation statistics using proprietary econometric methods and publishes the results with a three-day lag.
- Retailer and product selection: PriceStats selects retailers based on market share and city presence and includes over 500,000 daily prices — far exceeding the 80,000 monthly prices used by the BLS.
- Use of CPI weights and no quality adjustments: State Street PriceStats applies official CPI weights where possible and adjusts for online data characteristics, calculating price changes only from consecutive observations of identical products — without applying standard quality adjustments.


