
Insights
State Street PriceStats: Inflation rebounds

United States inflation gathered momentum again in September as rising energy and food prices pushed the annual inflation rate back up towards its peak for the year.
October 2026
The State Street PriceStats index rose 0.6 percent in September on a non-seasonally adjusted (NSA) basis, its largest monthly increase since May. Although still smaller than the energy-driven surges seen in the aftermath of the Iran conflict, the increase is sufficient to lift the annual inflation rate by a further 0.3 percentage points to 4.8 percent. With inflation now approaching May’s 5 percent peak, two consecutive months of acceleration in the annual rate is likely to raise concerns among investors and policymakers alike.
State Street PriceStats enables daily inflation measurement with just a three-day lag, offering timely insights that complement traditional government statistics. It serves as a valuable leading indicator and is especially useful during periods when government releases are delayed or unavailable. Its daily insights are increasingly relevant for policymakers, investors, and analysts seeking to track inflation dynamics in real time.
Covering over 27 countries and multiple sectors — including food, health, and transportation — State Street PriceStats uses consistent methodologies to ensure its indicators are comparable across geographies, time periods, and official data sources.
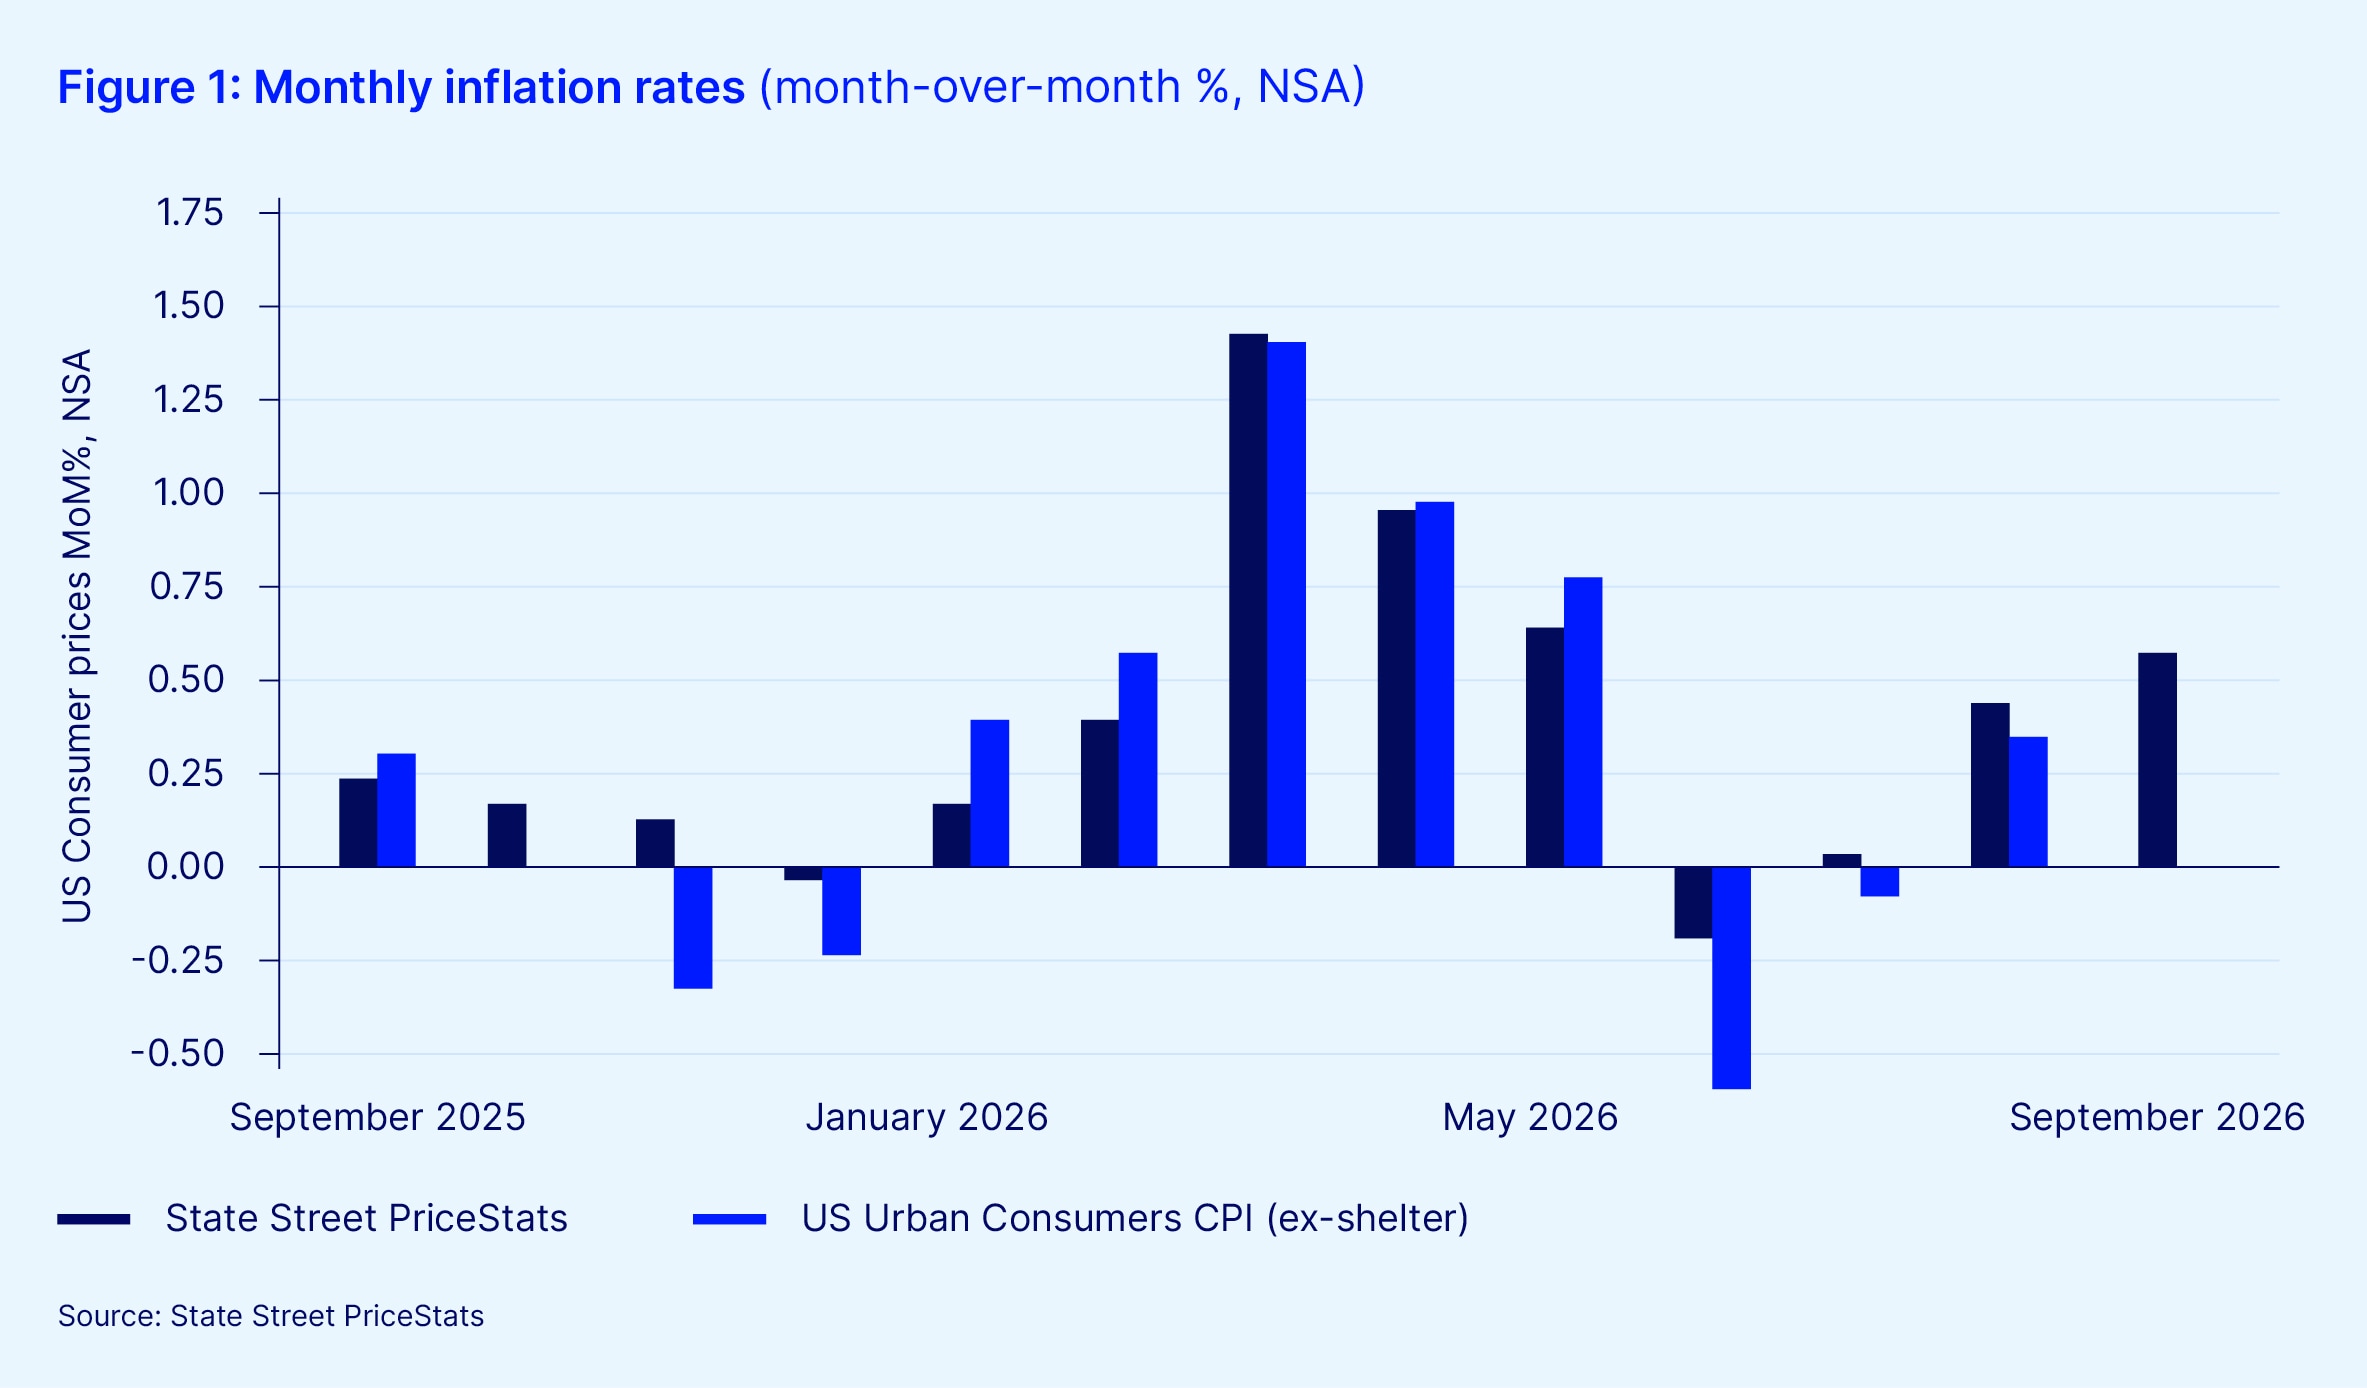
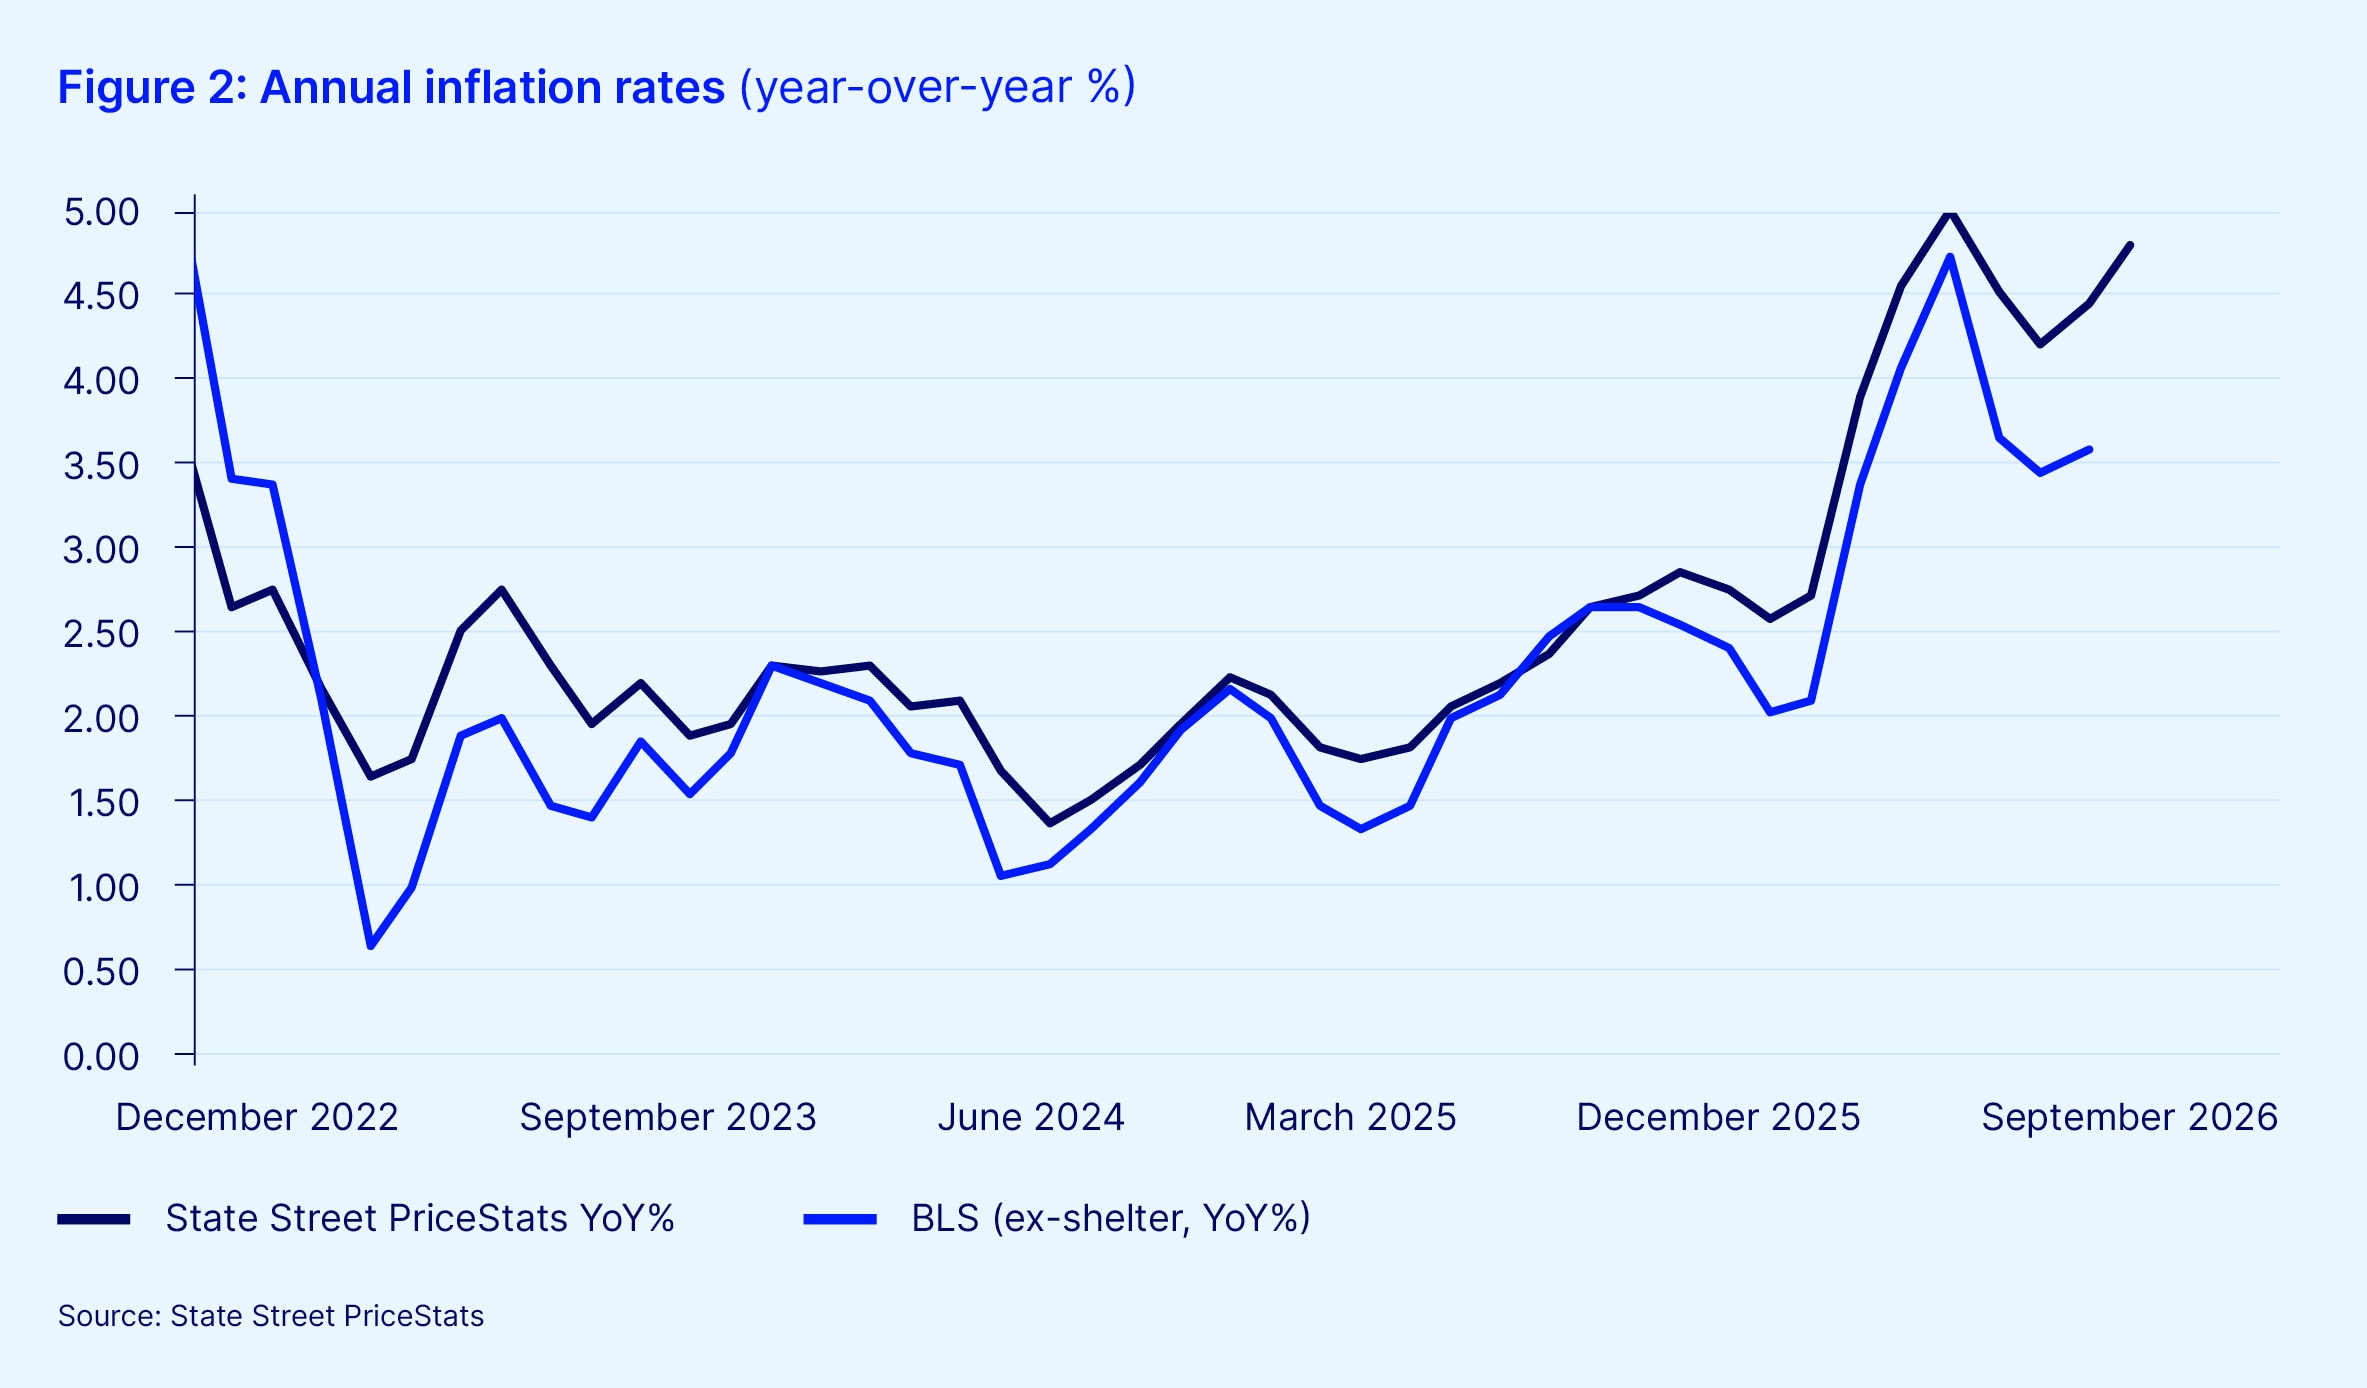
September’s 0.6 percent rise in the State Street PriceStats index reinforced August’s reflationary signal. Energy and transportation prices once again drove much of the increase, jumping nearly 2.3 percent on the month, with gasoline and diesel prices reaching record highs for September. Last month, we highlighted that firmer inflation would likely tip the balance toward Fed tightening. The latest reading is likely to sharpen the focus on whether further inflation acceleration will necessitate another tightening later this month. Beneath the headline, the picture is more encouraging. Increases in food, health, and beauty prices were in line with seasonal patterns, while apparel prices began their typical fall rebound. Household equipment and electronics were the only categories to show notable strength. This suggests that spillover from higher energy costs into broader, particularly core, inflation remains limited. However, if diesel prices remain elevated, pricing pressure on core goods may begin to build. For a committee already divided on the decision, a second consecutive month of renewed headline inflation is an unwelcome complication.
About the State Street PriceStats indicators
The State Street PriceStats series are designed to provide a low-latency and high-frequency view into inflation trends that is comparable to official consumer price index (CPI). The features of the process are as follows:
- Daily online price collection: State Street PriceStats collects price data daily from over 1,500 multi-line retailers using web scraping technologies, focusing on those with both online and physical stores. Research has shown that retailers tend to adjust online prices first.
- Data structuring and cleaning: Models then clean and standardize raw price data to ensure consistency across more than 40 million products, converting unstructured HTML into structured datasets ready for analysis.
- Categorization and quality checks: State Street PriceStats categorizes prices by economic sectors and sub-sectors, calculates performance statistics, and applies a red-flag system with daily manual checks to resolve data anomalies.
- Index calculation using econometric techniques: State Street PriceStats computes daily inflation statistics using proprietary econometric methods and publishes the results with a three-day lag.
- Retailer and product selection: State Street PriceStats selects retailers based on market share and city presence, and includes over 500,000 daily prices — far exceeding the 80,000 monthly prices used by the Bureau of Labor Statistics.
- Use of CPI weights and no quality adjustments: State Street PriceStats applies official CPI weights where possible and adjusts for online data characteristics, calculating price changes only from consecutive observations of identical products without applying standard quality adjustments.
For more information or to request a demo, visit our State Street PriceStats Solutions page.


